

ARL is investigating the use of satellite information about volcanic ash clouds to improve volcanic ash forecasts made with HYSPLIT. Some of this work has been described in a paper in the Journal of Geophysical Research – Atmospheres: Crawford, B. J. B. Stunder, F. Ngan, M. J. Pavolonis (2016), Initializing HYPSLIT with satellite observations of volcanic ash: A case study of the 2008 Kasatochi eruption, J. Geophys. Res. Atmos., 121, doi:10.1002/2016JD024779 http://onlinelibrary.wiley.com/doi/10.1002/2016JD024779/full
Abstract: The current work focuses on improving volcanic ash forecasts by integrating satellite observations of ash into the Lagrangian transport and dispersion model, HYSPLIT. The accuracy of HYSPLIT output is dependent on the accuracy of the initialization: the initial position, size distribution, and amount of ash as a function of time. Satellite observations from passive infrared, IR, sensors are used both to construct the initialization term and for verification. Space-based lidar observations are used for further verification. We compare model output produced using different initializations for the 2008 eruption of Kasatochi in the Aleutian Islands. Simple source terms, such as a uniform vertical line or cylindrical source above the vent, are compared to initializations derived from satellite measurements of position, mass loading, effective radius, and height of the downwind ash cloud. Using satellite measurements of column mass loading of ash to constrain the source term produces better long-term predictions than using an empirical equation relating mass eruption rate and plume height above the vent. Even though some quantities, such as the cloud thickness, must be estimated, initializations which release particles at the position of the observed ash cloud produce model output which is comparable to or better than the model output produced with source terms located above and around the vent. Space-based lidar data, passive IR retrievals of ash cloud top height, and model output agree well with each other, and all suggest that the Kasatochi ash cloud evolved into a complex three-dimensional structure.
For more information about volcanic cloud monitoring by the NOAA Cooperative Institute for Meteorological Satellite Studies (CIMSS), see http://volcano.ssec.wisc.edu/tutorials/.
HYSPLIT Kasatochi animations
The animations (below) show two types of plots which are paired. On the left of each pair is a plot of top height of model output as a function of latitude and longitude. The caption under this plot specifies the model initialization and meteorological dataset used (See Crawford et. al 2016 for details). An orange line intersecting the ash cloud shows the line of longitude along which a vertical profile is plotted on the right.
On the right of each pair is a vertical profile plot. In this plot, magenta points show the position (altitude and latitude) of HYSPLIT computational particles which are within 0.1 degree of the line of longitude. The blue crosses show the position of satellite retrieved top heights within 0.1 degree of the line of longitude.
The vertical profile plots show a series of cross sections of the ash cloud which move from east to west and give a sense of the complex three dimensional structure of the ash cloud. Although the top heights measured from satellite data and position of computational particles do not agree at every point, both give a similar qualitative picture of the structure of the ash cloud.
HYSPLIT animations
Time 1
|
Time 2
|
Time 3
|
Time 4
|
Time 5
|

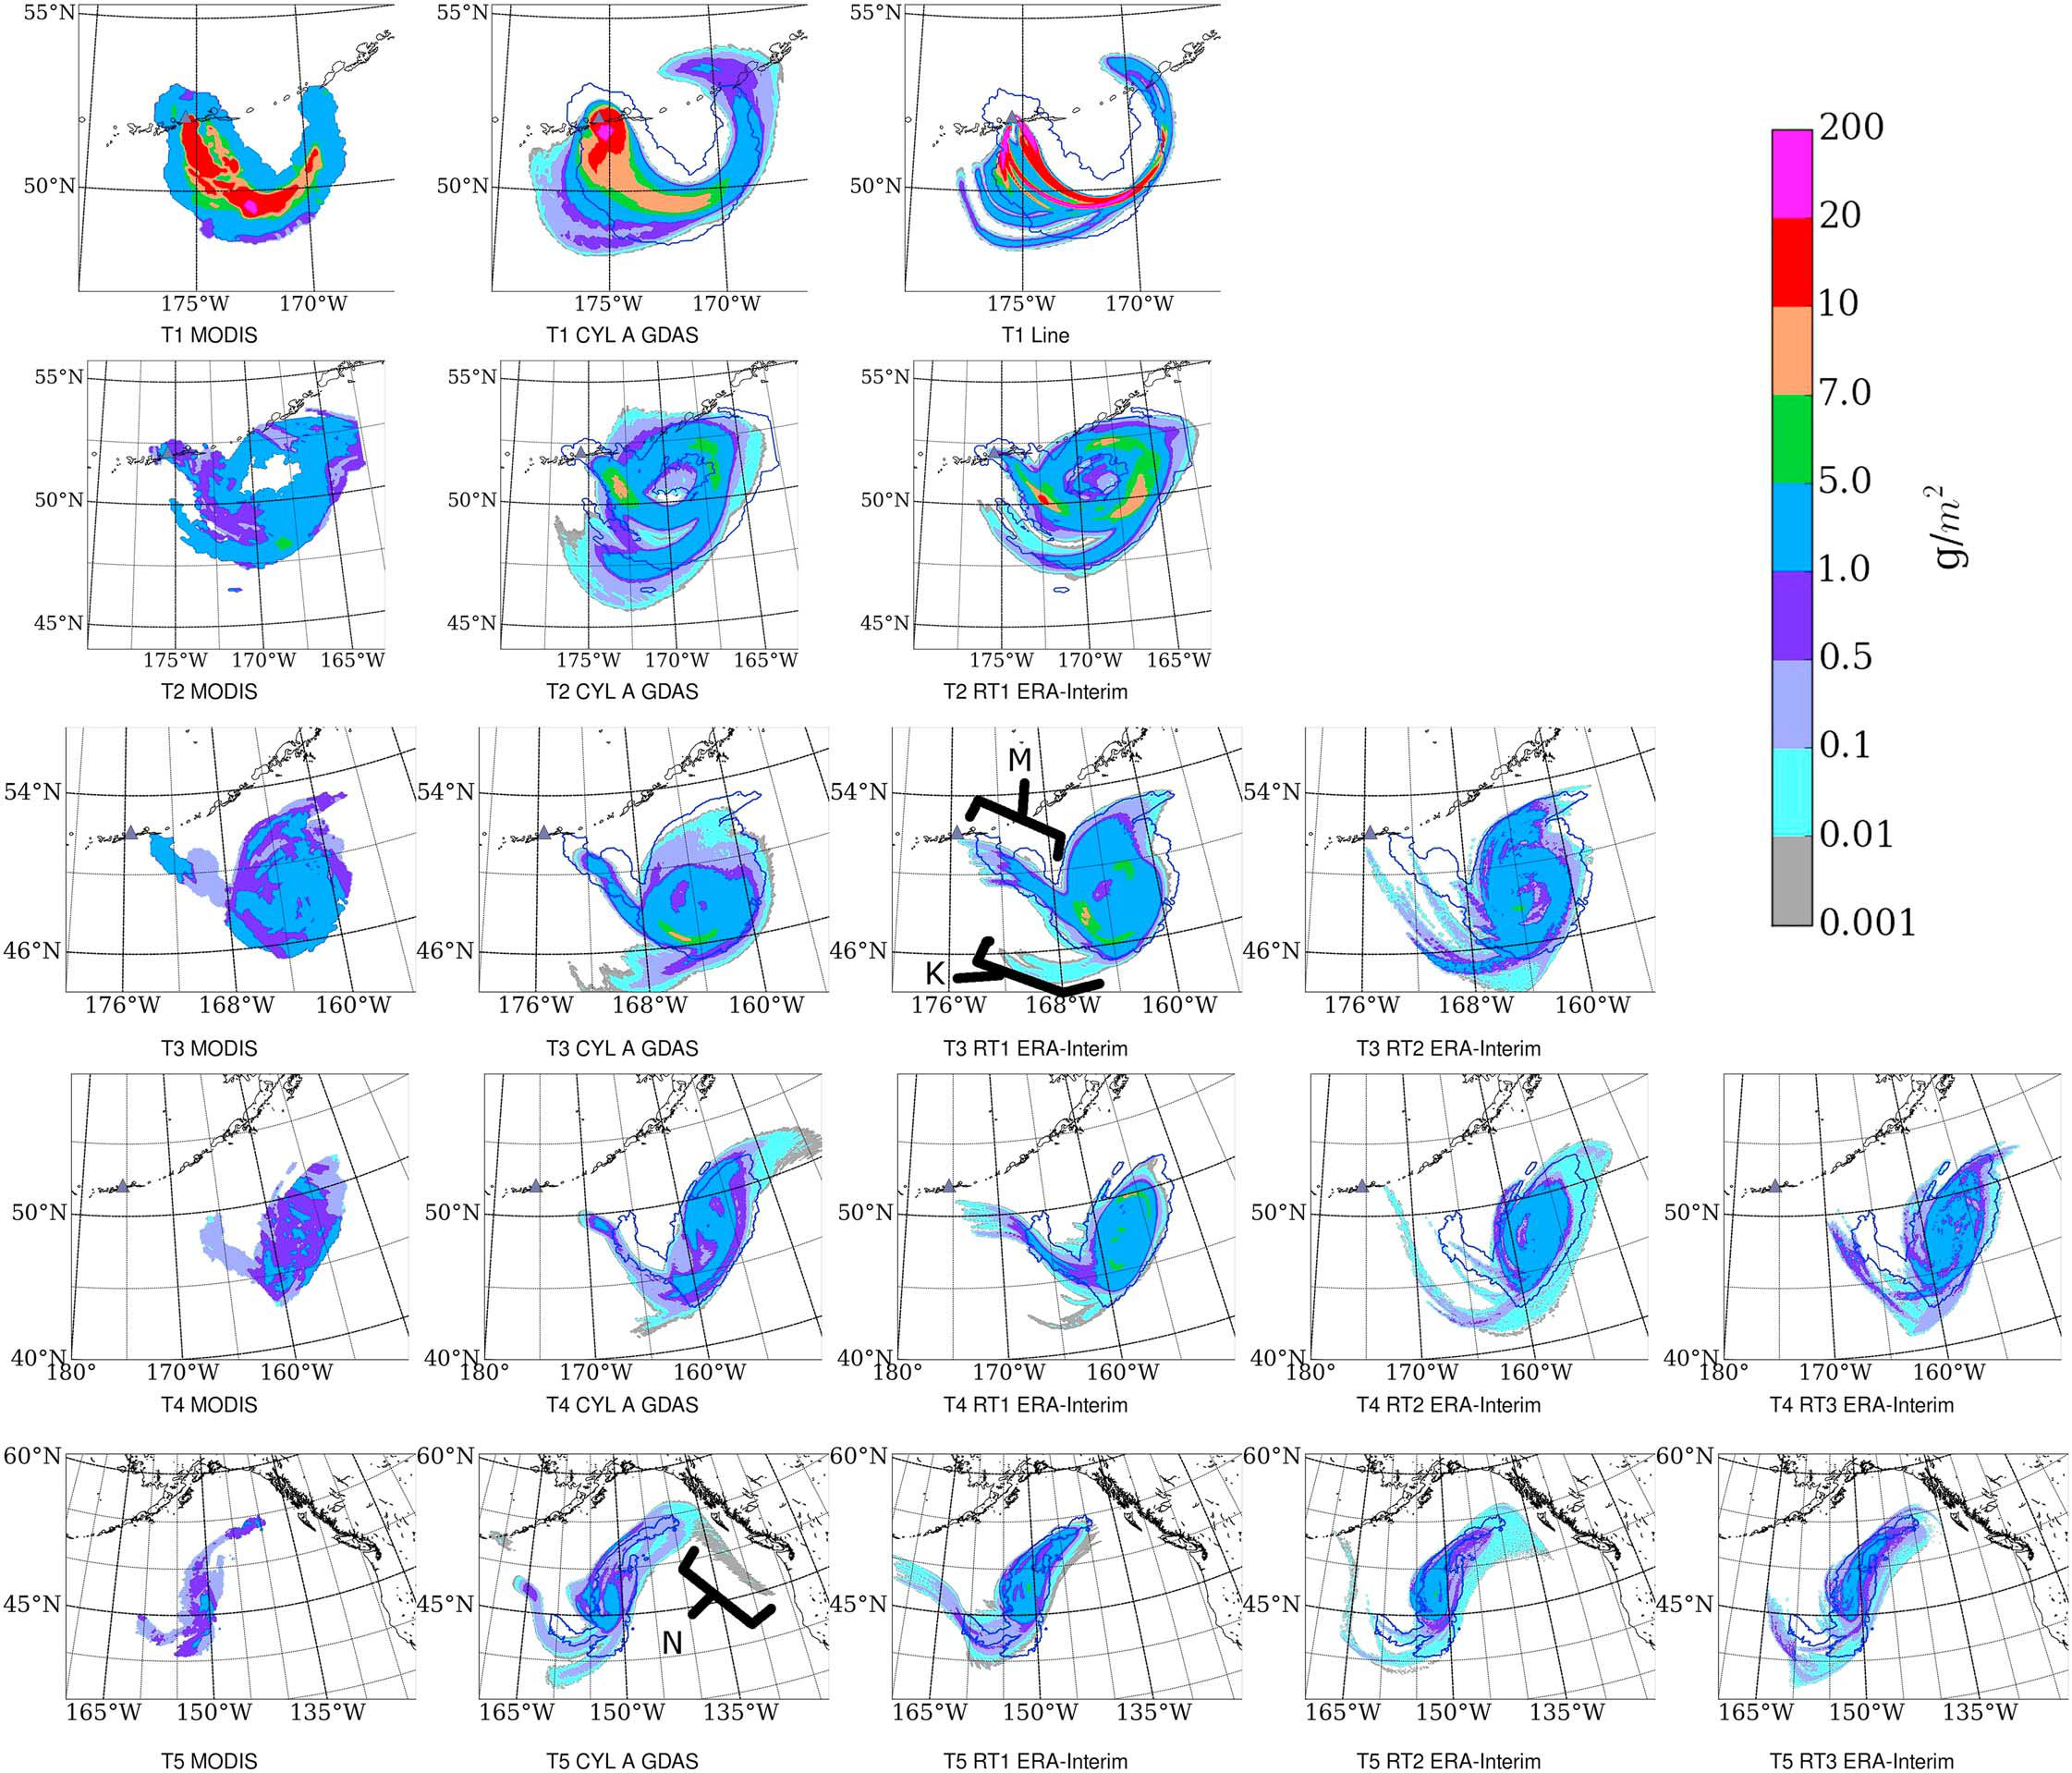
Contour plots of mass loading. (column 1) The satellite retrievals at (rows 1–5) T1-T5. (columns 2–5) HYSPLIT mass loading output with initializations and meteorology as labeled. The thick blue lines outline the footprint of the satellite retrieval shown in Figure 2 (column 1). The black triangle shows the location of Kasatochi. The color bar in the upper right corner applies to all plots. The feature labeled M in the T3 RT1 ECMG plot is an arm of high-altitude ash stretching northwest from the main ash cloud toward the volcano. The feature labeled K is an arm of low-altitude ash stretching southward from the main ash cloud. Crawford, A. M., B. J. B. Stunder, F. Ngan, and M. J. Pavolonis (2016), Initializing HYSPLIT with satellite observations of volcanic ash: A case study of the 2008 Kasatochi eruption, J. Geophys. Res. Atmos., 121, 10,786–10,803, doi:10.1002/2016JD024779.