

Results Overview
The statistical results from running HYSPLIT for each of the tracer experiments in the DATEM archive are summarized in this section. If available, the 32 km North American Regional Reanalysis (NARR; ftp://arlftp.arlhq.noaa.gov/narr/) meteorological data or the CONUS WRF 27-km dataset (WRF; Ngan and Stein, 2017; ftp://arlftp.arlhq.noaa.gov/archives/wrf27km/) were used for the computations, otherwise the 2.5 degree global reanalysis data (GBL; ftp://arlftp.arlhq.noaa.gov/pub/archives/reanalysis) were used. HYSPLIT revision v.5.0.0 was used for the simulations and the mixing configurations are listed in Table 1. The dispersion results were evaluated against measured tracer concentrations using four normalized statistical parameters, including the correlation coefficient (R), the fractional bias (FB), the figure of merit in space (FMS), and the Kolmogorov–Smirnov parameter (KSP). For each normalized parameter, the best score is 1 and the worst score is 0. Thus, the cumulative score (rank) ranges from 0 (worst) to 4 (best). The overall evaluation results are shown in Table 2 and Figure 3. The link to the RANK gives the complete statistical summary for that experiment. See the DATEM report for a more detailed description of the evaluation methodology.
The DATEM archive includes experiments on the spatial scales ranging from sub-kilometer to 1000’s km (Figure 1). Note that INEL74, SRPTEX, and ETEX were not included in the extensive evaluation since they took place either not in North America or before 1980; thus, the NARR and WRF datasets do not apply to them. The location of tracer experiments and the HYSPLIT domain coverage for each of them are shown in Figure 2. Here are brief descriptions of each of the tracer experiments used in the evaluation process.
- Atlantic Coast Unique Regional Atmospheric Tracer Experiment (ACURATE). Krypton-85 air concentrations were measured downwind from emissions of the Savannah River Plant, SC. 12 and 24 hour average air concentrations were collected for 19 months (March 1982 – September 1983) at 5 locations along the United States east coast from 300 km to 1000 km from the plant (Fayetteville, NC to Murray Hill, NJ).
- Across North America Tracer EXperiment (ANATEX). 66 PerFluorocarbon Tracer (PFT) releases (33 each from two different locations – January 5th to March 26th, 1987) were carried out every 2.5 days. Air samples were collected for 3 months over 24 h periods at 75 sites covering most of the eastern US and southeastern Canada. PTCH (perfluro-trimethylcyclohexane) was released from Glasgow, Montana (GGW), and PDCH (perfluro-dimethylcyclohexane) and PMCH (perfluro-monomethylcyclohexane) was released from St. Cloud, Minnesota (STC).
- Cross APpalachian Tracer EXperiment (CAPTEX). Six 3-hour PFT releases (September 18th to October 29th, 1983) were carried out, including four from Dayton, Ohio and two from Sudbury, Ontario, Canada. Samples were collected at 84 sites, 300 km to 800 km from the source, with 3-hour and 6-hour averaging periods, for about 48 hours after each release.
- OKlahoma Tracer EXperiment (OKTEX). A single release of two different PFT tracers (July 8th, 1980) was carried out over a 3 hour duration. Samples of 3-hour duration were collected at 10 sites 100 km and 35 sites 600 km downwind from the Oklahoma City release point from July 8th to July 11th, 1980.
- MEtropolitan Tracer EXperiment (METREX). 6-hour emissions of perfluorocarbons were carried out simultaneously, from two different locations, every 36 hours. The tracer release locations were in suburban Washington, D.C and 8-hour air samples were collected at three locations within the urban area. The experiment ran for one full year. In addition, monthly air concentration samples were collected at about 60 locations throughout the region.
- COlorado Springs Tracer EXperiment (COSTEX). Multiple releases using the tracers PTCH, PDCH, and PDCB were carried out at three locations in the Colorado Springs – Pueblo, Colorado region on October 18, 21, and 23, 2010. Ten sampling sites located up to 50 km away from the sources collected data with 30-minute averaging duration over a 3.5 hour period during each release.
- Idaho Field EXperiment (IFEX). Nine SF6 releases in South East Idaho over the Upper Snake River Plain were carried out between July 15 and 30, 1981. The tracer was released over an 8-hour duration at 46 m above ground level. Sampling was carried out at about 100 locations within a 24-km-square area, taking hourly concentration measurements for 12 sequential hours.
- Atmospheric Studies in COmplex Terrain (ASCOT). PMCH releases (from Anderson Creek) and PDCH releases (from Gunning Creek) were carried out in Northern California on five different nights in mid-September 1980 for a 1- hour duration. More than 50 sampling sites were placed in a 10-km-square area away from the release site to the southeast. Collection of samples took place over 10-, 15-, 20-, 60-, 120-, and 180-min durations at different samplers for about 7 hours from the start of the tracer release.
- Project SageBrush Phase 1 (PSB1). Five SF6 releases at the Idaho National Laboratory were carried out on five afternoons during October 2013. The sampling network consisted of concentric arcs located 200, 400, 800, 1600, and 3200 meters away from the release location. The tracer was released at a constant rate over 2.5 hours and sampling started 30 min after the release, producing 10-min-average measured concentrations.
- INEL74. About two months of Kr-85 releases (February 27th to May 5th, 1974) from Idaho National Engineering Laboratory were carried out with continuous 12- hour sampling at 11 locations about 1500 km downwind (Oklahoma City, OK to Minneapolis, MN).
- Savannah River Plant Tracer EXperiment (SRPTEX). Continuous emissions of Krypton-85 were carried out from the Savannah River Plant near Aiken, SC. About 15 sampling locations were placed around the plant at varying distances (15 – 150 km) and directions. Weekly samples were collected between September 1975 and August 1977. Twice-daily samples were collected over four months (November 1976, February, April, July of 1977).
- European Tracer EXperiment (ETEX). Although there were two releases, the primary evaluation data set is from the first release on October 23, 1994 from Monterfil, Brittany, France. Three-hour samples were collected in Western Europe from October 23 through October 27th.
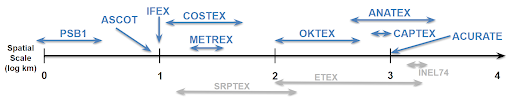
Figure 1. The schematic of the spatial scale (log km) of nine controlled tracer experiments in DATEM.
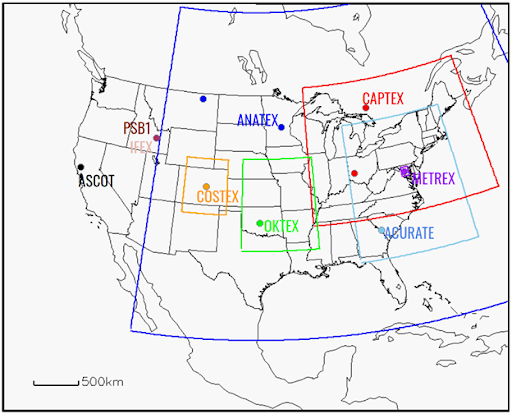
Figure 2. WRF modeling domain (the outer box, black line) and HYSPLIT domains of the nine controlled tracer experiments.
Table 1. HYSPLIT (revision v.5.0.0) runs using the NARR, WRF, and GBL datasets, and their corresponding mixing configurations.
| Name | Met data | Model wind | HYSPLIT PBL stability | HYSPLIT mixing |
| narr | NARR | Instantaneous wind | Wind/Temp profiles | TKE |
| wrf-kc | WRF | Instantaneous wind | Heat/momentum flux | Kantha-Clayson |
| wrf-tke | WRF | Time-averaged wind | Heat/momentum flux | TKE |
| gbl | GBL | Instantaneous wind | Wind/Temp profiles | Kanta-Clayson |
Table 2. Statistical rank for different HYSPLIT simulations.
| Experiment | narr | wrf-kc | wrf-tke | gbl |
| ACURATE | 2.27 | 2.16 | 2.11 | – |
| ANATEX GGW | 1.79 | 2.13 | 2.01 | – |
| ANATEX STC | 2.06 | 1.57 | 1.69 | – |
| CAPTEX (6 episodes) | 2.43 | 2.51 | 2.34 | – |
| OKTEX | 1.85 | 2.43 | 2.14 | – |
| METREX (PMCH) | 2.23 | 1.96 | 1.84 | – |
| METREX (PDCH) | 1.47 | 1.25 | 1.58 | – |
| COSTEX (AR1) | 1.47 | 1.93 | 2.02 | – |
| COSTEX (AR2) | 1.49 | 1.44 | 1.56 | – |
| COSTEX (AR3) | 1.73 | 2.02 | 2.01 | – |
| IFEX (9 episodes) | 1.65 | 1.79 | 1.46 | – |
| ASCOT (PMCH) | 0.66 | 0.44 | 0.11 | – |
| ASCOT (PDCH) | 0.68 | 0.65 | 0.46 | – |
| PSB1 (5 episodes) | 2.29 | 2.66 | 2.59 | – |
| INEL74 | – | – | – | 1.80 |
| SRPTEX | – | – | – | 1.31 |
| ETEX | – | – | – | 2.22 |
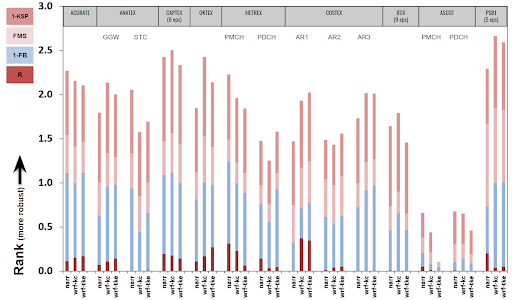
Figure 3. Statistical summary of HYSPLIT results driven by NARR data, WRF data, and different mixing configurations listed in Table 1.