

-
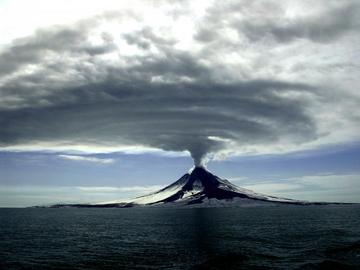
Mt. Augustine volcanic eruption
(Credit: Cyrus Read, U.S. Geological Survey)Volcanic ash is hazardous to aircraft because it can degrade engine performance and navigational and operational instrumentation. Meteorologists at the VAAC and the Meteorological Watch Offices use the HYSPLIT forecasts, among other sources of information, for writing Volcanic Ash Advisories and Significant Meteorological Information warning messages (called SIGMETs), respectively. The HYSPLIT dispersion forecasts are issued to the public and made available online, such as at the NWS Aviation Weather Center. Operationally, the NWS runs the ARL-developed HYSPLIT model to forecast the transport and dispersion of volcanic ash in and near the U.S. Volcanic Ash Advisory Centers (VAAC) (Anchorage, AK, and Washington, DC) areas of responsibility.
What We Do:
ARL scientists conduct supporting research to improve volcanic ash dispersion forecasts and transfer new or updated dispersion capabilities to operations at the NOAA National Weather Service (NWS). An ARL scientist is a member of the ICAMS (Interagency Council for Advancing Meteorological Services) Working Group for Volcanic Ash, which, in part, oversees the National Volcanic Ash Operations Plan for Aviation. ARL also supports the U.S. representative to the International Civil Aviation Organization (ICAO) Meteorological Operations Group (MOG) International Airways Volcano Watch (IAVW).
For More Information:
The READY volcanic ash web page contains links to:
- current HYSPLIT forecasts issued by NOAA, if any
- HYSPLIT output from hypothetical eruptions, and
- the ability to run HYSPLIT for any volcano using archived analysis or current forecast meteorology
- HYSPLIT trajectory forecasts for Alaskan volcanoes
The information below also provides an explanation of the volcanic ash model products and the history of the volcanic ash program at ARL.
List of Publications
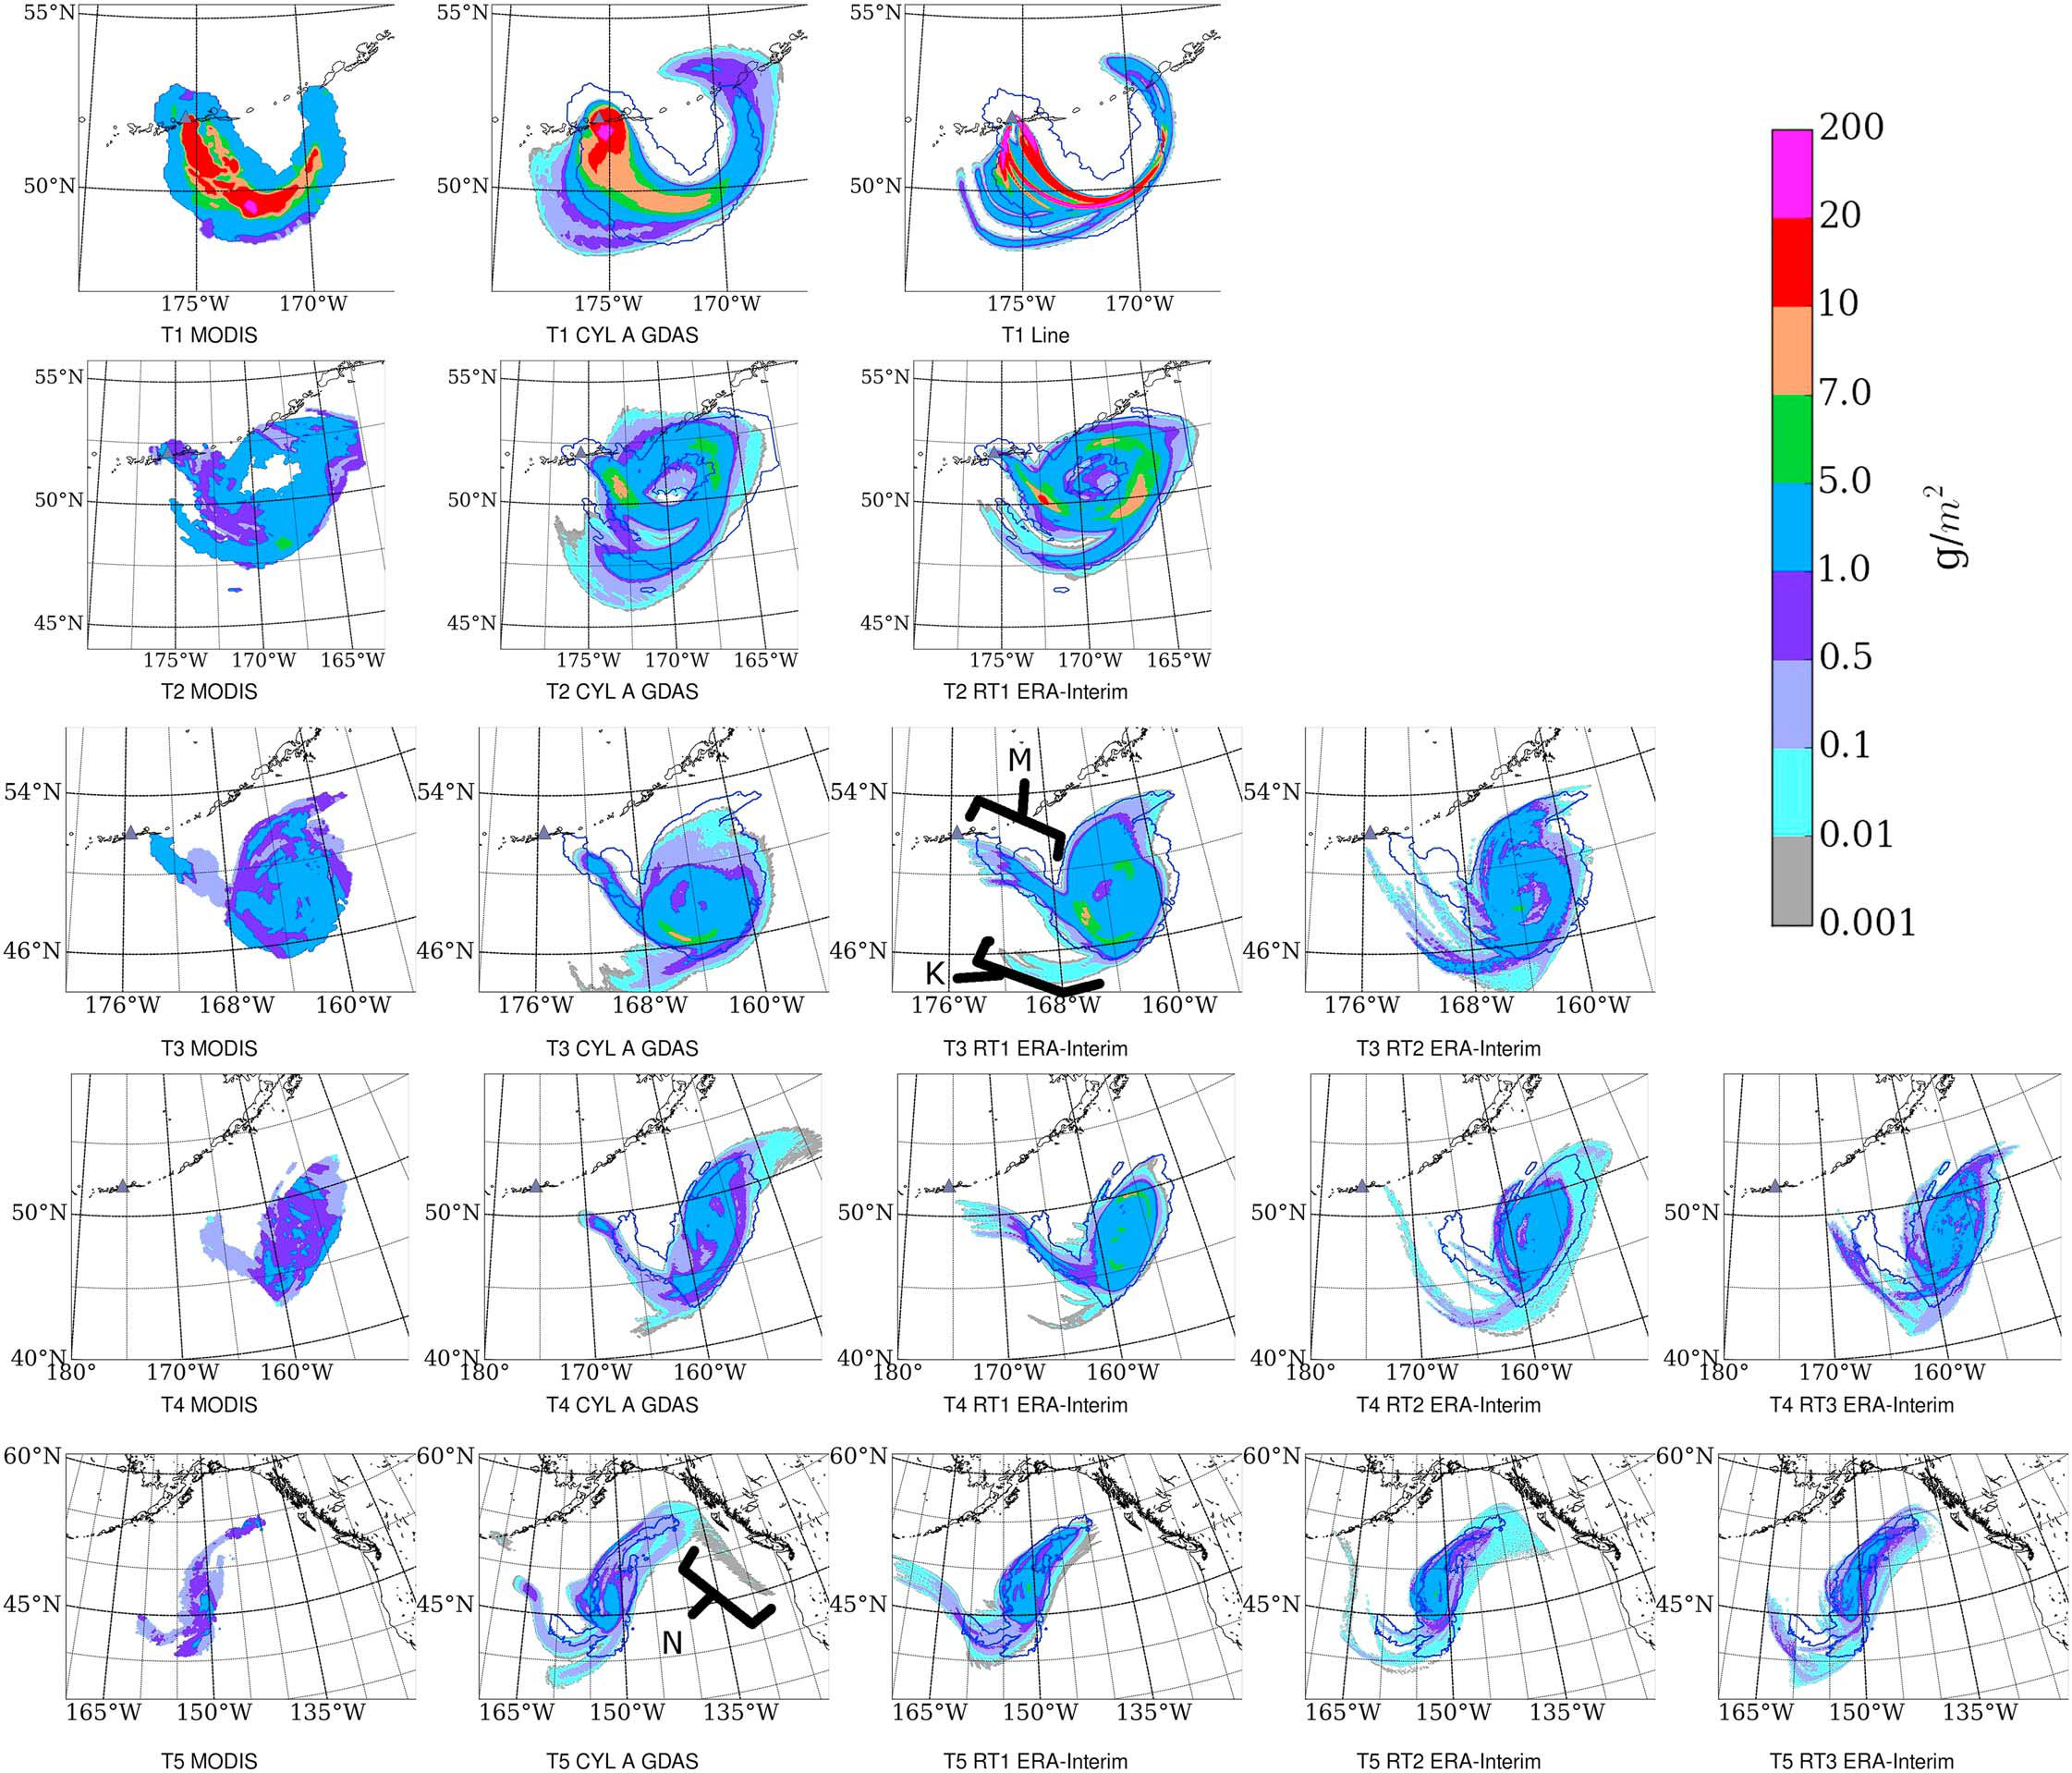
2008 Kasatochi eruption contour plots of mass loading (column 1). The satellite retrievals at (rows 1–5) T1-T5. (columns 2–5) HYSPLIT mass loading output with initialization and meteorology as labeled. The thick blue lines outline the footprint of the satellite retrieval shown in Figure 2 (column 1). The black triangle shows the location of Kasatochi. The color bar in the upper right corner applies to all plots. The feature labeled M in the T3 RT1 ECMG plot is an arm of high-altitude ash stretching northwest from the main ash cloud toward the volcano. The feature labeled K is an arm of low-altitude ash stretching southward from the main ash cloud.
- A. Crawford, T. Chai, B. Wang, A. Ring, B. Stunder, C. P. Loughner, M. Pavolonis, and J. Sieglaff. Evaluation and bias correction of probabilistic volcanic ash forecasts. Atmospheric Chemistry and Physics, 22(21):13967–13996, 2022. https://doi.org/10.5194/acp-22-13967-2022
- A. M. Crawford, B. J. B. Stunder, F. Ngan, M. J. Pavolonis, 2016. Initializing HYSPLIT with satellite observations of volcanic ash: A case study of the 2008 Kasatochi eruption, J. Geophys. Res. Atmos., 121, doi:10.1002/2016JD024779.
- T. Chai, A. Crawford, B. J. B. Stunder, M. J. Pavolonis, R. Draxler, A. Stein, 2017. Improving volcanic ash predictions with the HYSPLIT dispersion model by assimilating MODIS satellite retrievals, Atmos. Chem. Phys, 17, https://doi.org/10.5194/acp-17-2865-2017
- Crawford, A.: The Use of Gaussian Mixture Models with Atmospheric Lagrangian Particle Dispersion Models for Density Estimation and Feature Identification. Atmosphere 2020, 11, 1369. https://doi.org/10.3390/atmos11121369
- Mastin, L.G., M. Guffanti, R. Servranckx, P. Webley, S. Barsotti, K. Dean, A. Durant, J.W. Ewert, A. Neri, W.I. Rose, D. Schneider, L. Siebert, B. Stunder, G. Swanson, A. Tupper, A. Volentik, C.F. Waythomas, 2009: A multidisciplinary effort to assign realistic source parameters to models of volcanic ash-cloud transport and dispersion during eruptions Journal of Volcanology and Geothermal Research, 186:10-21.
- Webley, P.W., B.J.B. Stunder, and K.G. Dean. 2009: Preliminary sensitivity study of eruption source parameters for operational volcanic ash cloud transport and dispersion models — A case study of the August 1992 eruption of the Crater Peak vent, Mount Spurr, Alaska. Journal of Volcanology and Geothermal Research, 186:108-119.
- Stunder, B.J.B., J.L. Heffter, R.R. Draxler (2007), Airborne Volcanic Ash Forecast Area Reliability, Weather and Forecasting, 22:1132-1139, DOI: 10.1175/WAF1042.1
- Tupper, A., J. Davey, P. Stewart, B. Stunder, R. Servranckx, and F. Prata, 2006: Aircraft encounters with volcanic clouds over Micronesia, Oceania, 2002/03. Australian Meteorological Magazine, 55, 289-299.
- Heffter,J.L., 1996: Volcanic ash model verification using a Klyuchevskoi eruption. Geophy. Res. Letters, 23-12, 1489-1492.
- Heffter, J.L. and B.J.B. Stunder, 1993: Volcanic Ash Forecast Transport And Dispersion (VAFTAD) Model. Wea Forecasting, 8, 534-541.
- Heffter, J.L., B.J.B. Stunder, and G.D. Rolph, 1990: Long-range forecast trajectories of volcanic ash from Redoubt volcano eruptions. Bull. Amer. Meteor. Soc. 71(12):1731-1738.
Dispersion Simulations Using HYSPLIT
HYSPLIT is set to use the same volcanic ash source term and produce look-alike output graphics as VAFTAD (Heffter and Stunder, 1993). The main differences between running HYSPLIT for volcanic ash and running HYSPLIT at the ARL HYSPLIT web page (unregistered or registered) is in the source term (the initial conditions of the substance being modeled) and the output graphics. For volcanic ash, a set of particles of a given size distribution are uniformly distributed in a vertical layer above the volcano. Additional options, such as mass emission rate and wet deposition, are not available for running HYSPLIT on ARL’s volcanic ash webpage. All HYSPLIT options are available in the Windows-based version that may be downloaded from the HYSPLIT main page.
Brief description of volcanic ash dispersion modeling:
-
Eruption input
Required inputs are:
- Volcano latitude and longitude
- Volcano summit height
- Eruption date and time
- Eruption duration
- Ash column height
- Ash reduction level (none-small-medium-large)
Preset input is a unit source (1 g) since the actual amount is not known in real-time. The ash particle distribution is described below.
-
Meteorological data input
HYSPLIT inputs gridded meteorological data in a format described in the meteorological archives web page. Forecast meteorological fields in this format are routinely generated from NWS National Centers for Environmental Prediction (NCEP) runs of the Global Forecast System (GFS) and the North American Mesoscale (NAM) meteorological models and are available on an NCEP ftp server. Information on these HYSPLIT-compatible forecast datasets, as well as others produced by ARL, are available in the meteorological forecast data web page. In addition to these forecast files, GFS and NAM “archive” data (analysis and short-term forecasts) for the previous two days are routinely created at NCEP and are available on the NCEP ftp server. This permits running volcanic ash forecasts for large eruptions that occurred up to two days ago.
ARL also archives meteorological data in the HYSPLIT-compatible format. Information on these files is available in the meteorological archives web page.
-
Ash particle distribution
HYSPLIT calculates transport and dispersion of volcanic ash from an ash column extending from the volcano summit to the column top. The model uses spherical particles of density 2.5*10^6 g m-3 with diameters ranging from 0.3 to 30 microns. A particle distribution was derived from aircraft sampling of Mount St. Helens and Redoubt Volcano ash clouds (Hobbs, P. V., L. F. Radke, J. H. Lyons, R. J. Ferek, D. J. Coffman, and T. J. Casadevall, 1991: Airborne measurements of particle and gas emissions from the 1990 volcanic eruptions of Mount Redoubt, J. Geophys. Res., 96, 18 735-18 752.).
-
Ash cloud
Calculated concentrations relative to the unit emission have been correlated with satellite imagery (see verification discussion below) for defining the ash cloud. The model computation of the ash cloud includes the magnitude of the volcanic eruption as determined by an algorithm based on the ash column top height and column depth.
-
Reduced ash
For some volcanic eruptions, HYSPLIT forecasts a larger ash cloud than what is observed, partly because of water vapor in the eruption column. HYSPLIT is typically run in a “reduced ash” mode when satellite imagery shows a smaller ash cloud. Differences between the default (no reduction) run and a reduced ash run, if any, reflect some of the uncertainty in defining the eruption column.
-
Model output
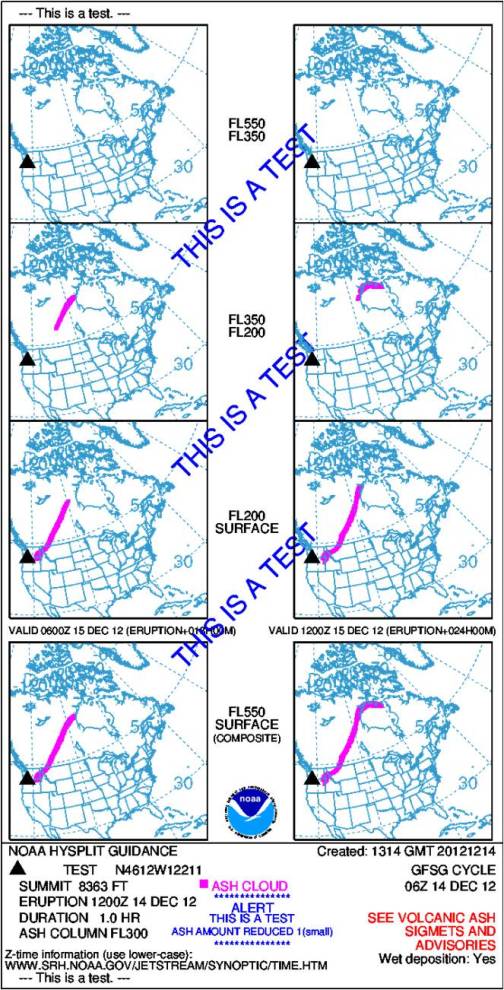
An example 8-panel “VAFTAD-format” chart of the forecast ash cloud is shown in Figure 1. The four panels in any column are for a single valid time after eruption. Individual panels are for layers applicable to aviation operations and are identified at the side of a panel with upper and lower flight levels (FL) in hundreds of ft. The bottom panel is a composite layer, from the SURFACE to FL550, and is useful for satellite imagery comparisons. For each column, the forecast valid time separates the upper three panels from the composite panel. Volcano eruption information is at the lower left. A description of the input meteorology is at the lower right. The ash cloud symbol is at the lower center. If a reduced ash level was used, it is indicated below the ash cloud symbol. HYSPLIT volcanic ash output issued by NOAA in response to a volcanic eruption includes a message to “SEE VOLCANIC ASH SIGMETS AND ADVISORIES” at the lower right. The example output shown is valid for ERUPTION+18 hours (left column) and ERUPTION+24 hours (right column).
Volcanic Ash Modeling History
Following the 1980 eruption of Mount St. Helens, a NOAA – Federal Aviation Administration (FAA) Memorandum of Understanding (MOU) on Volcanic Hazards Alert became effective in 1988. ARL’s contribution was to provide forecast trajectories. However, trajectories are limited in that they only provide a representation of the transport paths of single air parcels, rather than a simulation of the complex transport and dispersion of a 3-dimensional volume of ash particles. Hence, the NOAA Air Resources Laboratory developed the Volcanic Ash Forecast Transport And Dispersion (VAFTAD) model.
In 1992 VAFTAD was transferred to operations at the NOAA National Weather Service (NWS). The model output format (see image to right) had been developed in consultation with the FAA. In the late 1990s a network of Volcanic Ash Advisory Centers (VAAC) was established by the International Civil Aviation Organization (ICAO). Two of the North American VAAC are operated by NOAA. The ICAO format of the graphical dispersion forecast was initially that of VAFTAD.
In 2005 the ARL-developed Hybrid Single-Particle Lagrangian Integrated Trajectories model (HYSPLIT) replaced VAFTAD at the NWS. In 2007, the ICAO-formatted graphical product changed from the “VAFTAD-format” (2 pages, 8 plots per page, 12-h, 24-h, 36-h, and 48-h forecasts) to the “Volcanic Ash Graphic” (VAG) format (1 page, 4 plots per page, observation, 6-h, 12-h, and 18-h forecasts) to make the information in the text Volcanic Ash Advisory and the graphic (VAG) identical. At the same time, ICAO did not specify format requirements for dispersion model output, hence the NWS retained the “VAFTAD-format”. ICAO documentation including an example VAG and a description of the VAAC duties are given in the “International Standards and Recommended Practices, Annex 3 to the Convention on International Civil Aviation, Meteorological Service for International Air Navigation” available from ICAO.
For example VAG, see recent Washington and Anchorage products.
NOAA volcanic ash dispersion product.