Urban Atmospheric Monitoring and Modeling System (Urban-AMMS)

NOAA ARL is developing Urban-AMMS, an operational capability to measure and model fluxes of air pollutants in urban areas, in collaboration with other OAR labs (Global Monitoring Laboratory and Chemical Sciences Laboratory) as well as the National Institute for Standards and Technology (NIST). The system integrates existing, mature capabilities into an urban-scale operational system covering the Washington D.C. – Baltimore region. The system will include two fundamental capabilities:
  1. Impacts: Calculate the downwind impacts of pollutant fluxes to the air, critically important for protection of life and property, and
  2. Attribution: Calculate the locations and amounts of pollutant fluxes to the air based on atmospheric measurements, critically important for pinpointing where hazardous pollutant releases are occurring to mitigate threats to life and property.
Diagram that explains how emissions estimates are created.

Overall conceptual schematic of the Urban-AMMS system. The different elements in this figure are described in more detail below. Credit: Maria Raykova (NOAA/Groundswell)

Impacts

When pollutants are emitted to the air from routine, accidental or intentional sources, threats to life and property can occur downwind. The ability to quickly determine the downwind consequences — e.g., the concentrations of pollutants in the air that people would be breathing — is an essential part of emergency response and other efforts to reduce risks to life and property. In order to determine these consequences, one must use an atmospheric transport and dispersion model. The NOAA ARL HYSPLIT model is one of the most widely used and respected atmospheric transport and dispersion models, and has been under continuous development, evaluation, and improvement for more than 40 years1.

The HYSPLIT model is used operationally at the NOAA National Weather Service (NWS) to determine impacts from hazardous atmospheric emissions. In this system, NWS Weather Forecast Offices use the model to provide emergency response information to first responders and emergency management authorities. The Urban-AMMS project will build on this capability to quantify and reduce impact-determination uncertainties in urban areas by using Tracers of Opportunity and by improving the characterization of Urban Meteorology, as described below.

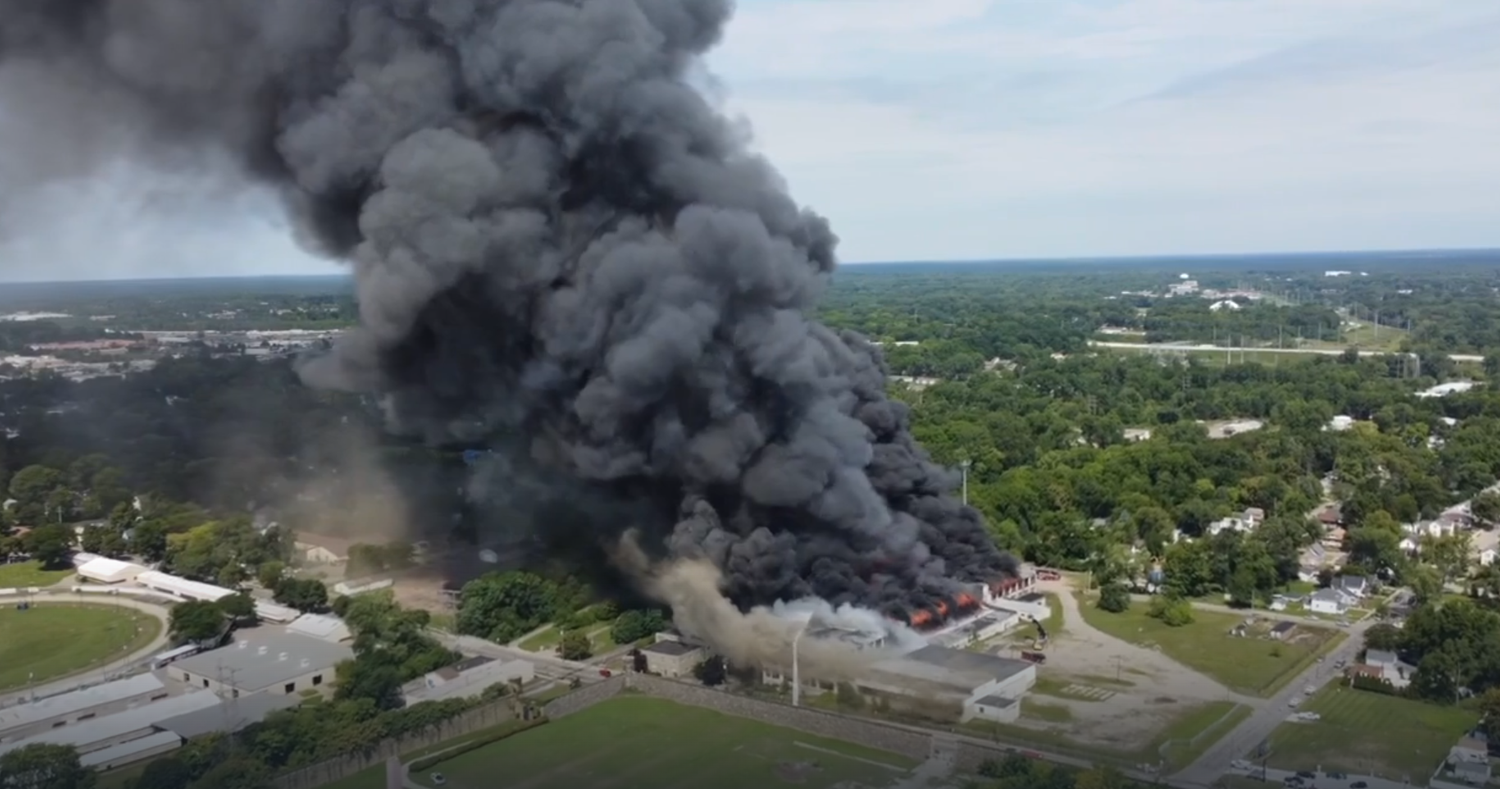
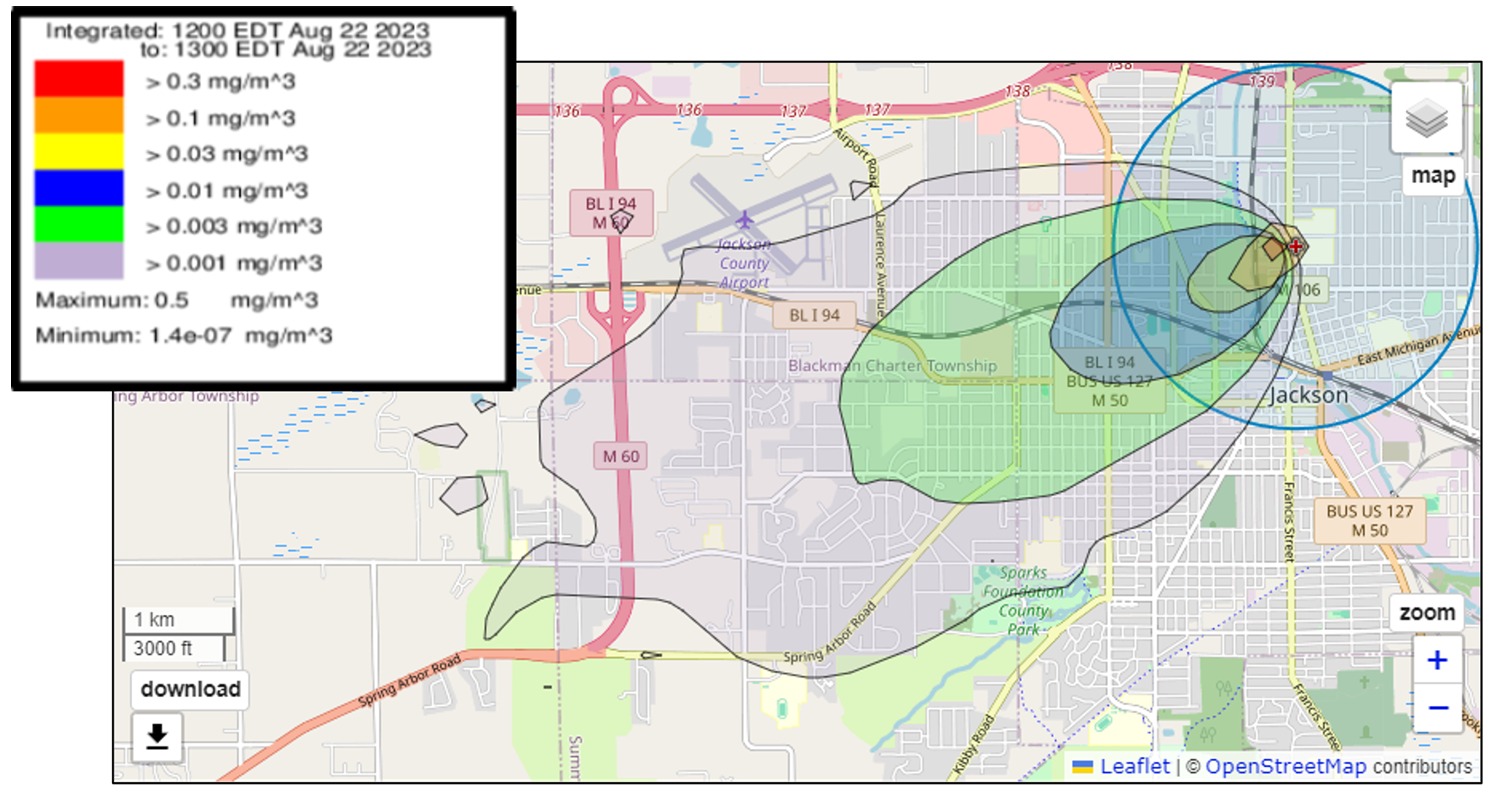
Left to Right: A fire destroyed an abandoned factory in Jackson, MI, on Aug 22, 2023. Credit: https://www.fox47news.com/large-fire-north-of-downtown-jackson; An example of HYSPLIT simulation results for the Jackson MI event, showing downwind concentrations of PM2.5 arising from the fire at the abandoned factory. Credit: NOAA ARL

Tracers of Opportunity

Uncertainties in urban transport and dispersion modeling will be quantified and reduced by carrying out Tracers of Opportunity tests. In these tests, the HYSPLIT  model, driven by high-resolution meteorological model output, is ground-truthed using locations with known emissions and downwind pollutant measurements. In these tests, the ability of the overall modeling system to link the known emissions with the known downwind concentrations will be evaluated. These evaluations will be used to quantify uncertainty in Impact analysis and to make improvements in the modeling system to reduce uncertainties.

The figure below illustrates conceptually how tracers of opportunity can be used in practice with both fixed-site measurements (as a function of time) and mobile and aircraft measurements (as a function of distance along a transect of the plume). The cases illustrated below allow the transverse transport and dispersion to be evaluated, but measurements can also be used in different ways to evaluate the longitudinal (along the plume direction) and vertical transport and dispersion. We note that due to the aircraft’s speed, the spatial resolution of the measurements within the plume will typically be much coarser than those from a mobile measurement platform. On the other hand, an aircraft can fly at different heights to examine the vertical profile of the transport and dispersion. In our experience in using the tracer of opportunity approach, care must be taken in the selection of the real-data cases to examine. In this proposed research, we will start with well-defined cases, but eventually, we will extend the approach to a much larger set of cases, using systematic algorithms to identify those suitable for model evaluation.

Conceptual diagram of the Tracers of Opportunity approach to evaluate and Improve the HYSPLIT Atmospheric Transport and Dispersion Model.
Credit: Mark Cohen (NOAA)

In Case 1, the wind direction changes over time, and the plume “passes” through the location of a fixed monitoring site. The model-predicted concentrations at that location as a function of time can be compared against the actual measurements as a function of time. The rate of wind direction change must be factored into this analysis, to relate time to distance in the model evaluation process. In the example shown, the modeled plume passes through the site at a later time – suggesting that the wind direction supplied to the model is not accurate. However, it is also seen that the width of the modeled and measured plume are significantly different, suggesting that the modeled transverse dispersion is being overestimated in this case. 

In Case 2, the wind is relatively constant, and mobile or aircraft measurements are made along a transect of the plume. The model predictions along this transect can be compared to the measurements along the transect. In the example shown, the wind direction supplied to the HYSPLIT model is incorrect, so the plume is in a different place. But also, the modeled plume is significantly wider than the measured plume, suggesting that the modeled transverse dispersion is being overestimated in this case. 

In both cases, simulation errors can be divided between meteorological transport errors – e.g., the wind speed/direction being supplied to the model – and errors in the HYSPLIT’s dispersion simulation around the mean wind field. 

HYSPLIT estimates vertical and horizontal dispersion using wind, temperature, friction velocity, stability, turbulence parameters and planetary boundary layer height from meteorological inputs. We will assess new and existing schemes to simulate turbulence and mixing in HYSPLIT and in the urban meteorological modeling carried out to drive the HYSPLIT model using the tracer of opportunity approach. 

Urban Meteorology

Fundamental inputs to the HYSPLIT model are meteorological parameters such as wind speed and direction, planetary boundary layer (PBL) height, and turbulence measures. These and other key meteorological parameters are provided to HYSPLIT based on the output from meteorological models. A fundamental goal of Urban-AMMS is to quantify and reduce uncertainties in urban meteorological modeling in order to provide more accurate data to drive HYSPLIT. The approach involves high-resolution meteorological simulations that assimilate a variety of meteorological measurements, and the evaluation of the simulations by comparing against meteorological measurements not used in the assimilation. A key source of the meteorological measurements assimilated or used in model evaluation is ARL’s UrbanNet. In this process, modeling methodologies such as subgrid PBL turbulence schemes can be evaluated and improved, leading to improvements in the characterization of urban meteorological phenomena.

Source Identification

If high concentrations of pollutants are observed in the atmosphere, it is important to quickly determine the locations and amounts of pollutants emitted upwind in order to mitigate the threat. The process of determining the sources of pollutants based on measured downwind concentrations is called a top-down estimating method or an atmospheric inversion. This type of system essentially determines what the emissions must have been (location(s), amount(s)) to have created the observed air concentrations. It is essentially the reverse of the problem being solved in assessing the Impacts described above. The Air Resources Laboratory was founded in 1948 as the Special Projects Section of the US Weather Bureau to carry out an atmospheric inversion to find the site of the first Soviet nuclear test based on observations of radioactivity downwind2. Since that time, ARL has carried out atmospheric inversions for a wide range of applications, including volcanic ash, wildfire smoke, radionuclides emitted from nuclear accidents and clandestine activities, industrial accidents and emissions, spy balloons, and urban trace gas emissions.

Observations

There are a number of air pollutant and meteorological monitoring sites and mobile platforms in the Washington D.C. / Baltimore metropolitan region, including those in the following list. Measurements from these networks and platforms are used to (1) evaluate or assimilate into urban meteorology models, (2) test urban transport and dispersion modeling of Impacts using the Tracer of Opportunity approach described above, and (3) calculate the locations and amounts of sources using the Attribution capability of Urban-AMMS:

  • EPA – RadNet, CASTNet, AMNet, National Trends Network, Air Quality System
  • NIST – Northeast Corridor Network – This network of tower-based stations was established in 2015 with the goal of quantifying fluxes in urban areas in the northeastern United States. A focus of the network is on Baltimore, MD, and Washington D.C., with a high density of stations in these two urban areas. Additional observing stations are available in the northeastern U.S. to provide supplementary data on emissions throughout this complex region with high population density and multiple metropolitan areas
  • NOAA – UrbanNet, Air Resources Car, Aircraft-based measurements, National Weather Service measurements and weather balloon soundings
  • State of Maryland: Ambient Air Monitoring Network, Maryland Mesonet
  • Commonwealth of Virginia: Air Monitoring
  • Howard University – Lidar system to measure vertical profiles of meteorological variables and turbulence
  • Unified Ceilometer Network to measure the Planetary Boundary Layer Height

HYSPLIT footprints for attribution

The NOAA HYSPLIT atmospheric transport and dispersion model creates a series of “footprints,” to estimate the sensitivity of measured pollutant concentrations to upwind surface fluxes. The footprints are calculated by running the model backward in time from each measurement site for each pollutant measurement. The footprint fields generated by HYSPLIT are one of the key inputs into the inversion model to estimate pollutant fluxes. They help determine which emissions locations should be adjusted, and the magnitude of the adjustments, based on the observed pollutant concentrations.

Biogenic emissions

Fluxes resulting from photosynthesis, respiration and other processes in natural ecosystems affect trace pollutant concentrations in the atmosphere. The measurements of pollutants in the region reflect the net result of biogenic and non-biogenic fluxes. Thus, biological processes must be accounted for in order to estimate non-biogenic fluxes. There are a variety of models and measurements that can be used to estimate biogenic pollutant fluxes.

HYSPLIT generated footprints driven by the HRRR numerical weather prediction model output from one NIST tower in Arlington, VA, covering measurements taken during the afternoon hours (12-4pm EST) in January 2019. Higher footprint values reveal regions that are more susceptible to surface fluxes that impact the measurements at this location and time window. HYSPLIT simulations suggest that for those hours, Arlington, VA was more sensitive to pollutant fluxes from the south-southwest and northwest. The diamonds show the locations of all NIST towers. Credit: NOAA/ARL

Background concentrations / boundary fluxes

For any pollutant, the amount that may enter the modeling domain from outside the domain must be accounted for in interpreting measurements in the modeling domain. This can be done in a variety of ways, including using measurements near the boundaries and using regional, national, and global models to estimate the urban “background.”

Emissions prior estimates

In carrying out atmospheric inversions, Urban-AMMS will generally start with a first guess and then estimate how that guess should be adjusted to be consistent with downwind measurements. There are a number of data sources to provide first guesses, including EPA, DOE, USFS, NIST and NOAA databases and emissions-estimating methodologies. The GRA2PES emissions inventory system developed by NOAA’s Chemical Sciences Laboratory (CSL) in collaboration with NIST is one such data source. The EPA/NOAA CAMEO-ALOHA emissions modeling system is another such system that has already been integrated into the HYSPLIT model to estimate emissions from hazardous material releases.

Inversion using CarbonTracker-Lagrange

Once the above system components are assembled for a given episode, they are used as inputs to the CarbonTracker-Lagrange (CT-L) inversion model developed by NOAA’s Global Monitoring Laboratory (GML). Conceptually, CT-L uses the time series of measured atmospheric pollutant concentrations in the DC / Baltimore region to estimate how much — and where — the pollutant must have been emitted upwind of the measurement sites to produce the observed signals. The HYSPLIT footprints driven with the meteorological model fields provide the linkage between the emissions and observed concentrations required by the inversion technique. 

Uncertainties

A fundamental component of Urban-AMMS is estimates of uncertainties in the emissions estimates being generated. Users of the data need to be aware of these uncertainties in order to better interpret the results of the system. Analysis of uncertainties in each of the system elements, and the entire system, will be continuously carried out in the operational system and included in the results provided by the system. Examples of different approaches that will be used to characterize uncertainties in the system include the following:

Comparisons against observations. Meteorological modeling results will be compared against observations in the region, e.g., from ARL’s UrbanNet. The system’s ability to create attributions will be tested by comparison against fixed-site and mobile- and aircraft-based measurements carried out in the region. To this end, NOAA carries out mobile measurements with a specially outfitted vehicle, known as the Air Resources Car, throughout the Washington D.C.-Baltimore region. Flight-based measurement campaigns are carried out in the region in collaborations between NOAA, NIST, the University of Maryland, and other institutions.

Ensembles. Uncertainties in the system’s calculations will also be characterized and quantified by carefully chosen ensembles, based on variations in inputs and simulation procedures that reflect the uncertainties in various system components. The spread of the differently calculated results can help characterize the uncertainty in the overall estimates of Impacts and Attribution. 

End-to-end system

An end-to-end system is being developed and implemented to carry out all of the operations and estimates of the system in an automated manner. When fully implemented, the end-to-end system will carry out all of the operations outlined above. Parallel computations will be employed where possible — in cases where more than one element can be carried out at a time — and serial computations will be used for elements that require the results of previous computations. Specific input and output formats will be used so that a given element can be changed if desired and the new component can be incorporated into the system, in a “plug and play” manner. Throughout the end-to-end system, numerous quality assurance/quality control checks will be performed on all elements to ensure proper operation, and to recognize if something needs to be corrected. The system will be designed to be as robust as possible so that estimates can be made reliably and sustainably moving forward.

1Stein, A. F., B. B. Hicks, L. Myles, and M. Simon, 2023: NOAA’s Air Resources Laboratory—75 Years of Research Linking Earth and Sky: A Historical Perspective. Bull. Amer. Meteor. Soc., 104, E2155–E2170, https://doi.org/10.1175/BAMS-D-23-0006.1.

2 Machta, L., 1992: Finding the Site of the First Soviet Nuclear Test in 1949. Bull. Amer. Meteor. Soc., 73, 1797–1806, https://doi.org/10.1175/1520-0477(1992)073<1797:FTSOTF>2.0.CO;2.