

ARL Weekly News – September 9, 2022
| Recent Events |
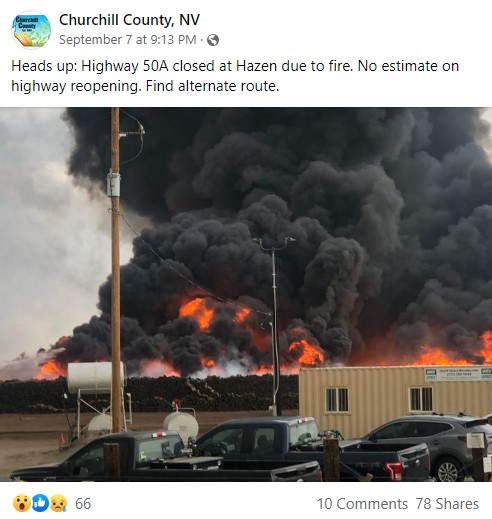
Hazen NV HAZMAT situation uses HYSPLIT modeling
Multiple agencies responded to a fire of railroad ties in Hazen, NV on September 7, 2022. The large black smoke plume caused concern for the air quality in the area, as railroad ties are treated with creosote. Evacuations were issued for those living within a half mile of the yard.
NWS Reno coordinated with the FEMA to respond to the incident. HYSPLIT trajectories were run to assist local agencies in understanding the smoke trajectory.


| Papers Published |
Clark, N. E., S. Pal, and T. R. Lee, 2022: Empirical evidence for frontal modifications of atmospheric boundary layer depth variability over land. Journal of Applied Meteorology and Climatology, 61, 1041-1063, https://doi.org/10.1175/JAMC-D-21-0099.1.
Abstract: Despite many observational studies on the atmospheric boundary layer (ABL) depth zi variability across various time scales (e.g., diurnal, seasonal, annual, and decadal), zi variability before, during, and after frontal passages over land, or simply zi variability as a function of weather patterns, has remained relatively unexplored. In this study, we provide an empirical framework using 5 years (2014–18) of daytime rawinsonde observations and surface analyses over 18 central and southeastern U.S. sites to report zi variability across frontal boundaries. By providing systematic observations of front-relative contrasts in zi (i.e., zi differences between warm and cold sectors, Δzi = ziWarm−ziCold) and boundary layer moisture (i.e., ABL-q) regimes in summer and winter, we propose a new paradigm to study zi changes across cold-frontal boundaries. For most cases, we found deeper zi over the warm sector than the cold sector in both summer and winter, although with significant site-to-site variability in Δzi. Additionally, our results show a positive ΔqABL (i.e., frontal contrasts in ABL-q) in summer and winter, supporting what is typically observed in midlatitude cyclones. We found that a front-relative ΔqABL of 1 g kg−1 often yielded at least a 100-m Δ zi across the frontal boundary in both summer and winter. This work provides a synoptic-scale basis for zi variability and establishes a foundation for model verification to examine the impact of airmass exchange associated with advection on zi. This work will advance our understanding of ABL processes in synoptic environments and help unravel sources of front-relative zi variability.
Buisán, S. T., Serrano-Notivoli, R., Kochendorfer, J., and Bello-Millán, F. J. (2022). Adjustment of solid precipitation during the Filomena extreme snowfall event in Spain: from observations to “true precipitation”. Bulletin of the American Meteorological Society (published online ahead of print 2022), https://doi.org/10.1175/BAMS-D-22-0012.1
Abstract: On January 2021, the heaviest snowfall in five decades hit central Spain, especially affecting Madrid. The city’s Barajas international airport closed, along with a number of roads, and all trains to and from Madrid were cancelled.
This storm was named Filomena by The Spanish Meteorological Agency (AEMET), and produced continuous snowfall in Spain on 7-10 January. The observed snow depth was around 50 cm in 24 h in Madrid, and even higher in other areas of Spain. However, the measured accumulation of national precipitation gauges was not consistent with the observed accumulated snow on the ground and with the modeled weather forecast.
The undercatch of solid precipitation was the primary reason for this inconsistency. This undercatch was quantified using transfer functions developed from the World Meteorological Organization (WMO) Solid Precipitation Intercomparison Experiment (SPICE).
Results show that an underestimation of 20-30 % of solid precipitation in large areas of Spain was observed, with some areas experiencing even larger differences. Without adjustments, it was impossible to accurately validate the model forecast. The adjusted precipitation was also more realistically distributed, and it was more consistent with all the damage that occurred.
The same methods can be applied to other snowfall events occurring anywhere in the world, and also using different precipitation gauges and/or models.
This an example of the type of extreme events that modelers, forecasters, and climatologists should be aware of to avoid misinterpreting differences between modelled precipitation, observed precipitation, and nowcasting.
| Papers Accepted |
A manuscript entitled “New parameterizations of turbulence statistics for the atmospheric surface layer” by Temple Lee and Tilden Meyers was accepted for publication in Monthly Weather Review. In this work, we developed new bulk Richardson parameterizations for different turbulence statistics using datasets from the Land Atmosphere Feedback Experiment. We then evaluated the performance of the new parameterizations using independent datasets and found that the Richardson parameterizations performed better than long-standing relationships derived using Monin-Obukhov Similarity Theory. These results, coupled with work last year in which we developed Richardson parameterizations for surface-layer momentum, heat, and moisture fluxes, provide further evidence to consider using Richardson-based parameterizations to represent surface-layer exchange processes in weather forecasting models.
Gallo K., and P. Krishnan, 2022, “Evaluation of the bias in the use of clear-sky compared with all-sky observations of monthly and annual daytime Land Surface Temperature,” Journal of Applied Meteorology and Climatology, https://doi.org/10.1175/JAMC-D-21-0240.1
Abstract: Satellite-derived observations of land surface temperature (LST) are being utilized in a growing number of land surface studies; however, these observations are generally obtained from optical sensors that exclude cloudy observations of the land surface. The impact of using only clear-sky observations of land surfaces on monthly and annual estimates of daytime LST over two United States Climate Reference Network (USCRN) sites were evaluated over five-years with daily in situ LST observations available for all-sky (clear and cloudy) conditions. The in situ LST observations were obtained for the nominal daytime observations associated with the MODIS sensors onboard the Terra and Aqua satellites and were identified as all-sky or clear-sky by utilizing cloud information provided with the MODIS LST product. Both monthly/annual mean and monthly/annual maximum values of daytime LST were significantly different when only clear-sky values are utilized, compared to all-sky values. Monthly averaged differences between the mean clear- and all-sky daytime LST (dLST) values ranged from −0.1 ± 1.5 °C for January to 5.6 ± 1.8 °C for May. Annually averaged dLST values, over the five years of the study, were 2.58 °C while differences between the maximum values of clear- and all-sky daytime LST values were −1.03 °C. While significant differences between mean annual clear-sky and all-sky daytime LST values were more frequent than differences observed for the annual maximum daytime LST values, the results suggest that the exclusive use of either mean or maximum clear-sky daytime LST values is not advisable for applications in which the use of daytime all-sky LST values would be more applicable.