

ARL Weekly News – March 20, 2020
| Upcoming Events |
National Air Quality Forecasting Capability (NAQFC) Emission Update: The ARL NAQFC team (Drs. Pius Lee, Youhua Tang, Patrick Campbell and Daniel Tong) is responsible for assuring NAQFC forecast performance. One of their responsibilities involves the quality assurance and inclusion of the latest major point-source emissions from large exhaust stacks in power plants and large energy generation facilities. These tall stacks are equipped with continuous monitoring devices to measure sulfur dioxide (SO2) and nitrogen oxide (NOx) emission rates. ARL’s team acquired these latest annual data in various temporal averages via the U.S. Energy Information Administration. They superimposed these data with an annual energy consumption outlook projection by the Department of Energy (DOE) to calculate major point source emission strengths for SO2 and NOx for 2020 – the upcoming forecast year. DOE customarily releases such outlook projections in late January of the forecast year. Both SO2 and NOx are major precursors for ozone (O3) and particulate matter equal to or less than 2.5 µm in diameter (PM2.5). The U.S. Environmental Protection Agency uses O3 and PM2.5 as the most critical criteria pollutants defining air quality that impact human health. The ARL team performed sensitivity studies using the projected point-source emission for a summer and a winter case. They presented the new emissions’ projected impact on air quality to their National Centers for Environmental Prediction (NCEP) counterparts. The figure below shows the relative surface concentration changes for O3 and PM2.5 for the summer case when compared against the baseline concentrations based on the 2019 emissions.
ARL’s team estimated that these updated point source SO2 and NOx emissions:
• Would impact the spatially averaged U.S. O3 concentration by less than 1% from their corresponding 2019 values;
• There could be a few local maxima in the industrialized regions in the Northeast U.S. where O3 concentration could be a few percent different from their corresponding 2019 values;
• In terms of PM2.5, its concentration picture is roughly the same as the aforementioned O3;
• There could be a few local maxima around the Mississippi Valley area where the PM2.5 concentration could be a few tens of percent different from their corresponding 2019 values.
NCEP approved the projected point source update for implementation; subsequently, ARL will deliver the updated emission to NCEP’s operational supercomputer. The updated NAQFC emission will take effect starting on April 15, 2020.
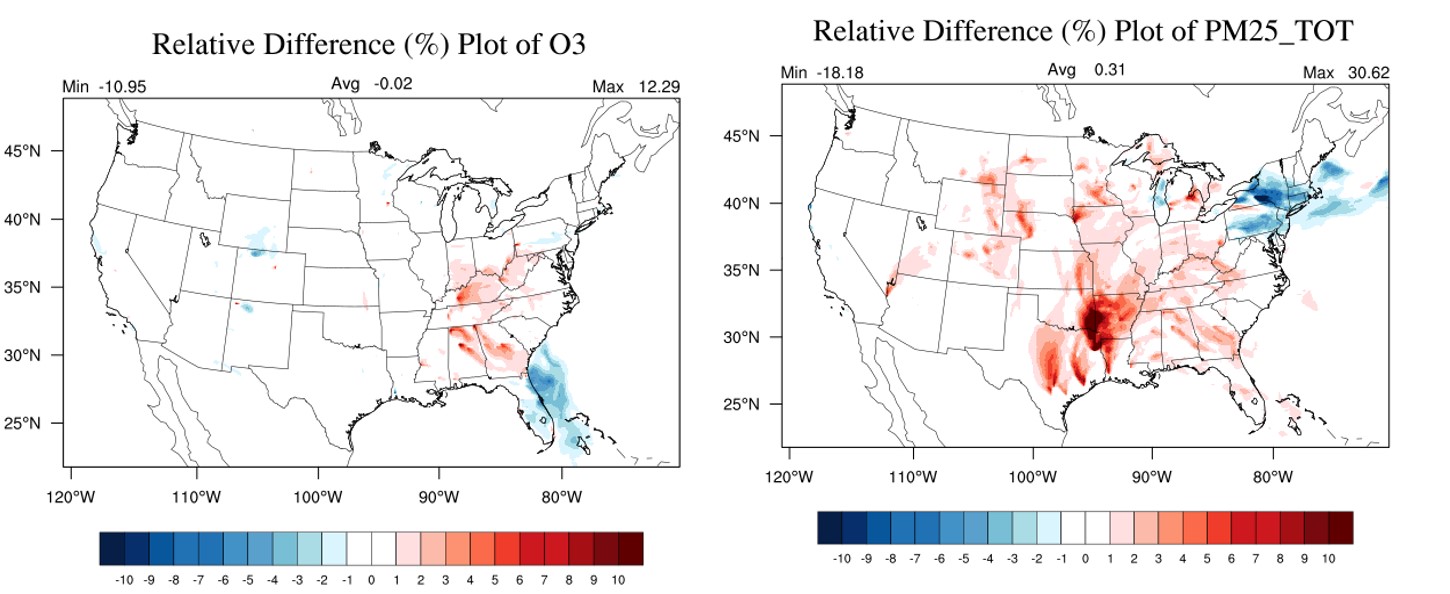
Illustration of the relative surface concentration changes for O3 and PM2.5 in summer compared to baseline concentrations based on 2019 emissions. Credit: NOAA
| Recent Events |
Workshop on Snow: Bruce Baker virtually attended a NOAA/National Weather Service sponsored workshop on snow. It was originally planned to be held in College Park, Maryland, on March 18-19 until the COVID-19 restrictions were implemented. The workshop aimed to:
• Bring together the snow observation and research communities
• Review existing observational capabilities and resources, to include NOAA’s inventories of requirements and products
• Identify high-priority NOAA products with unmet observational requirements
• Identify existing capabilities, new technologies, and mature research that could meet these requirements and readily transition to operations
• Target snow-related funding solicitations toward applied research proposals that leverage new technologies and meet observational requirements.
Bruce was on a panel on Snow Observations and provided an overview of the contribution that OAR/ARL’s U.S. Climate Reference Network added to the World Meteorological Organization’s Solid Precipitation Intercomparison that took place 2011-2016.
Postcard From the Field: ARL’s involvement in the 2019 Albuquerque International Balloon Fiesta was highlighted in a Postcard From the Field disseminated by the NOAA Office of Communications on March 23, 2020. ARL’s small unmanned aircraft systems (sUAS) were flown throughout the event, held October 5-13, 2019 in Albuquerque, New Mexico, with Ed Dumas serving as one of three aircraft pilot-in-command. Our sUAS provided near real-time vertical profiles of temperature, relative humidity, and winds as part of daily targeted forecasting for the 650 balloon pilots in attendance.

Credit: NOAA
| Publications |
“Updating Chinese SO2 emissions with surface observations for regional air-quality modeling over East Asia,” coauthored by Hyun Cheol Kim, was accepted for publication in Atmospheric Environment.
“The long-term trend and production sensitivity change of the U.S. ozone pollution from observations and model simulations,” coauthored by Daniel Tong, was accepted for publication in Atmospheric Chemistry and Physics.
“Contribution of HONO to the atmospheric oxidation capacity in an industrial zone in the Yangtze River Delta region of China,” coauthored by Xinrong Ren, was accepted for publication in Atmospheric Chemistry and Physics.
Abstract: A suite of instruments were deployed to simultaneously measure nitrous acid (HONO), nitrogen oxides (NOx = NO + NO2), carbon monoxide (CO), ozone (O3), volatile organic compounds (VOCs, including formaldehyde (HCHO)), and meteorological parameters near a typical industrial zone in Nanjing of the Yangtze River Delta region, China, from 1 to 31 December 2015. High levels of HONO were detected using a wet chemistry-based method. HONO ranged from 0.03-7.04 ppbv (parts per billion by volume) with an average of 1.32 ± 0.92 ppbv. Elevated daytime HONO was frequently observed with a minimum of several hundreds of ppbv on average, which cannot be explained by the homogeneous OH + NO reaction (POH+NO) alone, especially during periods with high loadings of particulate matters (PM2.5). The HONO chemistry and its impact on atmospheric oxidation capacity in the study area were further investigated using an MCM-box model. The results show that during the campaign period the average hydroxyl radical (OH) production rate was dominated by the photolysis of HONO (7.13×10⁶ molecules cm-3 s-1), followed by ozonolysis of alkenes (3.94×10⁶ molecules cm-3 s-1), photolysis of O3 (2.46×10⁶ molecules cm-3 s-1) and photolysis of HCHO (1.60×10⁶ molecules cm-3 s-1), especially within the plumes originated from the industrial zone. Model simulations indicated that heterogeneous chemistry played an important role in HONO formation. The average nighttime NO2 to HONO conversion rate was determined to be ~0.8% hr-1. Good correlation between nocturnal HONO/NO2 and the products of particle surface area density (S/V) and relative humidity (RH), S/V×RH, supports the heterogeneous NO2/H2O reaction mechanism. The other HONO source, designated as Punknonwn, was about twice as much as POH+NO on average and displayed a diurnal profile with an evidently photo-enhanced feature, i.e., photosensitized reactions of NO2 may be an important daytime HONO source. Nevertheless, our results suggest that daytime HONO formation was mostly due to the light-induced conversion of NO2 on aerosol surfaces but heterogeneous NO2 reactions on ground surface dominated nocturnal HONO production. Our study indicated that elevated PM2.5 level during the haze events can promote NO2 to HONO conversion by providing more heterogeneous reaction sites and hence increase the atmospheric oxidation capacity, which may further promote the formation of secondary air pollutants.