

ARL Weekly News – June 5, 2020
| Upcoming Events |
Ariel Stein will serve as an instructor for the National Science Foundation’s Planetary Boundary Layer Workshop, taking place June 15-26, 2020. Dr. Stein will teach attendees how to use ARL’s HYSPLIT model to calculate trajectories and concentrations.
| Recent Events |
In response to a formal request from the Office of Representative Mike Thompson (D-CA-05), ARL was requested to provide information on the historic variability in regional wind patterns in Napa County, California, and more specifically, St. Helena since the 1960s and the degree to which these patterns may have changed over time, with an emphasis on possible changes in wind speed. The request was directed from OAR’s Congressional Team to NOAA’s ARL. Requests like this are surprisingly common, and Dr. Howard Diamond, as ARL’s Climate Science Program Manager, has fulfilled similar requests via his role of fielding questions from the public for NOAA’s Climate Portal (see https://climate.gov). In a teleconference with Mr. Rick Gelinas from Congressman Thompson’s office that was arranged by NOAA’s Legislative Affairs, it was revealed that the primary reason for this request had to do with the relationship of any possible wind changes since the 1960s which may have an impact on some of the horrific wildfires in California over the past few years. Dr. Diamond had analyzed both wind station data from the San Francisco International and Sacramento Executive Airports dating back to 1948, as these were the closest airports to Napa County that had that long a record in order to produce a climatology that the Congressman’s office was looking for. Additionally, gridded wind data was analyzed to back up the trends found, which were actually (and in keeping with a general global stilling of terrestrial winds) decreasing since the 1960s buy small amounts. The Congressman’s office was impressed by the data analysis given on the teleconference on June 5th, and Dr. Diamond will follow up with a report summarizing everything that will first go to the OAR Congressional Team for clearance within OAR.
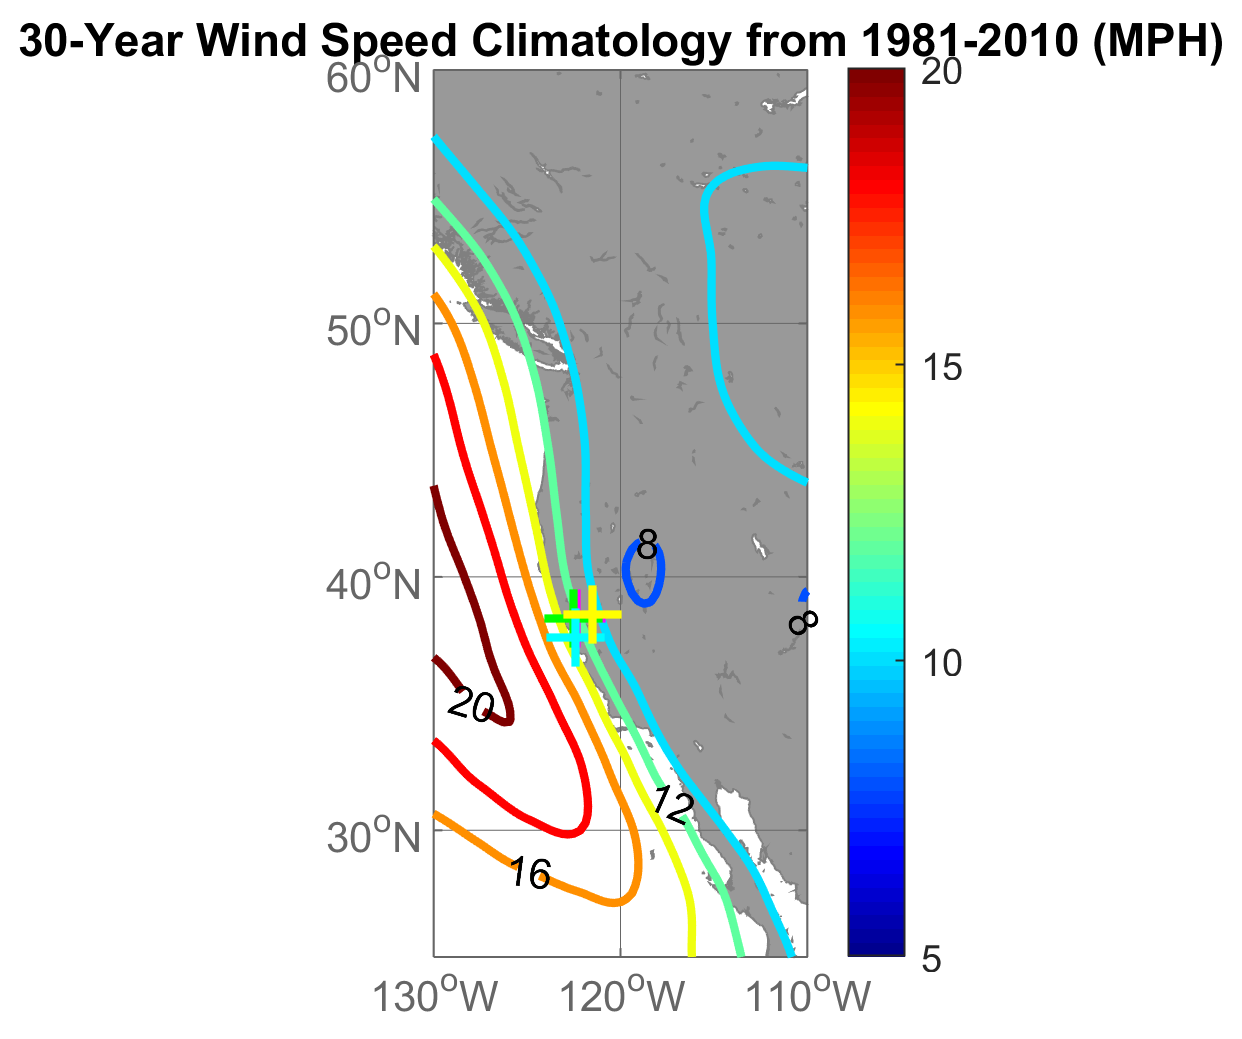
NOAA reanalysis of wind station data in Napa County, CA from 1981-2010. Credit: NOAA
| Publications |
Howard Diamond co-authored “Unparalleled coupled ocean-atmosphere summer heatwaves in the New Zealand region: drivers, mechanisms and impacts”. This paper was published in Climatic Change and featured in a New Zealand Herald article titled “Why our seas scorched: NZ’s back-to-back freak marine heatwaves”.
Summary: The paper examines the conditions and explanation for the three most intense coupled ocean-atmosphere heatwaves in the NZ region in 1934/35, 2017/18, and 2018/19, an area covering approximately 4 million km2, in the southwest Pacific. All three heatwaves exhibited: (1) maximum sea surface temperature anomalies to the west of the South Island of NZ; (2) atmospheric circulation anomalies with a strong blocking centered over the Tasman Sea between Australia and NZ, and extending southeast of NZ; (3) strong positive Southern Annular Mode conditions, and (4) reduced trough activity over NZ. In addition, the paper documents effects of these events on:
(a) Ice loss in the Southern Alps;
(b) Sauvignon blanc and Pinot noir wine grape production;
(c) Austral summer fruit harvest (cherries and apricots) blooming;
(d) Austral spring wheat grain yields and tuber quality in the potato crop; and
(e) Major species disruption that occurred in marine ecosystems around NZ.
Abstract: During austral summers (DJF) 1934/35, 2017/18 and 2018/19, the New Zealand (NZ) region experienced the most intense coupled ocean-atmosphere heatwaves covering an area of approximately 4 million km2 in each case. Average air temperature anomalies over land were +1.7 to 2.1°C above average while sea surface temperatures (SST) were 1.2 to 1.9°C above average. All three heatwaves exhibited maximum SST anomalies to the west of the South Island of NZ. Atmospheric circulation anomalies show a pattern of strong blocking centered over the Tasman Sea and extending south-east of NZ, accompanied by strongly positive Southern Annular Mode conditions, and reduced trough activity over NZ. Rapid melt of seasonal snow occurred in all three cases. For the two most recent events, very shallow anomalies of sub-surface ocean temperature were observed. Ice loss in the Southern Alps was estimated at 7.0 km3 water equivalents (w.e.) (17% of the 2017 volume). Sauvignon Blanc and Pinot noir wine grapes had above average berry number and bunch mass in 2018 but were below average in 2019. Summer fruit harvest (cherries and apricots) was 14 and 2 days ahead of normal in 2017/18 and 2018/19 respectively. Spring wheat simulations suggested earlier flowering and lower grain yields compared to average, and below-average yield and tuber quality in potatoes crops occurred. Major species disruption occurred in marine ecosystems. Hindcasts indicate the heatwaves were either atmospherically driven or arose from combinations of atmospheric surface warming and oceanic heat advection.
Citation: Salinger, M.J., Diamond, H.J., Behrens, E. et al. Unparalleled coupled ocean-atmosphere summer heatwaves in the New Zealand region: drivers, mechanisms and impacts. Climatic Change (2020). https://doi.org/10.1007/s10584-020-02730-5
John Kochendorfer is the lead author of “Undercatch Adjustments for Tipping-Bucket Gauge Measurements of Solid Precipitation,” published in the Journal of Hydrometeorology on June 4.
Summary: Using winter measurements from five different international precipitation testbeds, adjustments were derived to improve tipping bucket precipitation measurements.
Abstract: Heated tipping bucket (TB) gauges are used broadly in national weather monitoring networks, but their performance for the measurement of solid precipitation has not been well characterized. Manufacturer-provided TB gauges were evaluated at five test sites during the World Meteorological Organization Solid Precipitation InterComparison Experiment (WMO-SPICE), with most gauge types tested at more than one site. The test results were used to develop and evaluate adjustments for the undercatch of solid precipitation by heated TB gauges. New methods were also developed to address challenges specific to measurements from heated TB gauges. Tipping bucket transfer functions were created specifically to minimize the sum of errors over the course of the adjusted multi-seasonal accumulation. This was based on the hypothesis that the best transfer function produces the most accurate long-term precipitation records, rather than accurate catch efficiency measurements or accurate daily or hourly precipitation measurements. Using this new approach, an adjustment function derived from multiple gauges was developed that performed better than traditional gauge-specific and multi-gauge catch efficiency derived adjustments. Because this new multi-gauge adjustment was developed using six different types of gauge tested at five different sites, it may be applicable to solid precipitation measurements from unshielded heated TB gauges that were not evaluated in WMO-SPICE. In addition, this new method of optimizing transfer functions may be useful for other types of precipitation gauges, as it has many practical advantages over the traditional catch efficiency methods used to derive undercatch adjustments.
Citation: Kochendorfer, J., M.E. Earle, D. Hodyss, A. Reverdin, Y. Roulet, R. Nitu, R. Rasmussen, S. Landolt, S. Buisán, and T. Laine, 2020: Undercatch Adjustments for Tipping-Bucket Gauge Measurements of Solid Precipitation. J. Hydrometeor., 21, 1193–1205, https://doi.org/10.1175/JHM-D-19-0256.1
Youhua Tang is the lead author of “Air quality impacts of the 2018 Mt. Kilauea Volcano eruption in Hawaii: A regional chemical transport model study with satellite-constrained emissions”, accepted for publication in Atmospheric Environment. ARL co-authors include Daniel Tong, Pius Lee, Barry Baker, Alice Crawford, Winston Luke, Ariel Stein, Patrick Campbell and Allison Ring.