ARL Weekly News – (add date)
| Recent Events |
Publication: Impacts of tiled land cover characterization in the Model for Prediction Across Scales‐Atmosphere (MPAS‐A)

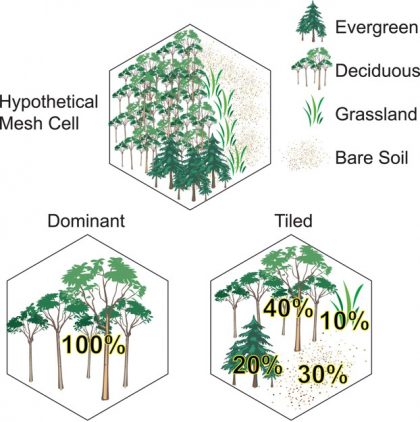
Illustration of a hypothetical “real‐world” land cover in a hexagonal mesh cell in MPAS‐A, and the corresponding dominant versus L13‐tiled approach to LCC used in the MPAS/Noah LSM.
Dr. Patrick Campbell is lead author (in collaboration with co-authors at the U.S. EPA and Boston University) on a new paper in Journal of Geophysical Research-Atmospheres, “Impacts of tiled land cover characterization in the Model for Prediction Across Scales‐Atmosphere (MPAS‐A)”. In this work, Campbell et al. implement a subgrid tiled approach as an option in MPAS‐A, version 6.0, and assess the impacts of tiled LCC on meteorological predictions for two gradually refining meshes (92‐25 and 46‐12 km) focused on the conterminous U. S for January and July 2016. Compared to the dominant approach, results show that using the tiled LCC leads to pronounced global changes in 2‐m temperature (July global average change ~ ‐0.4 K), 2‐m moisture, and 10‐m wind speed for the 92‐25 km mesh. The tiled LCC reduces mean biases in 2‐m temperature (July U.S. average bias reduction ~ factor of 4) and specific humidity in the central and western U.S. for the 92‐25 km mesh, improves the agreement of vertical profiles (e.g., temperature, humidity, and wind speed) with observed radiosondes; however, there is increased bias and error for incoming solar radiation at the surface. The inclusion of subgrid LCC has implications for reducing systematic temperature biases found in numerical weather prediction models, particularly those that employ a dominant LCC approach.
Citation: Campbell, P. C., Bash, J. O., Herwehe, J. A., Gilliam, R. C., & Li, D. (2020). Impacts of tiled land cover characterization in the Model for Prediction Across Scales‐Atmosphere (MPAS‐A). Journal of Geophysical Research: Atmospheres, 125, e2019JD032093. https://doi.org/10.1029/2019JD032093
Publication: Using near-road observations of CO, NOy, and CO2 to investigate emissions from vehicles: Evidence for an impact of ambient temperature and specific humidity
Xinrong Ren co-authored a paper entitled “Using near-road observations of CO, NOy, and CO2 to investigate emissions from vehicles: Evidence for an impact of ambient temperature and specific humidity”, which was published in Atmospheric Environment (https://doi.org/10.1016/j.atmosenv.2020.117558).
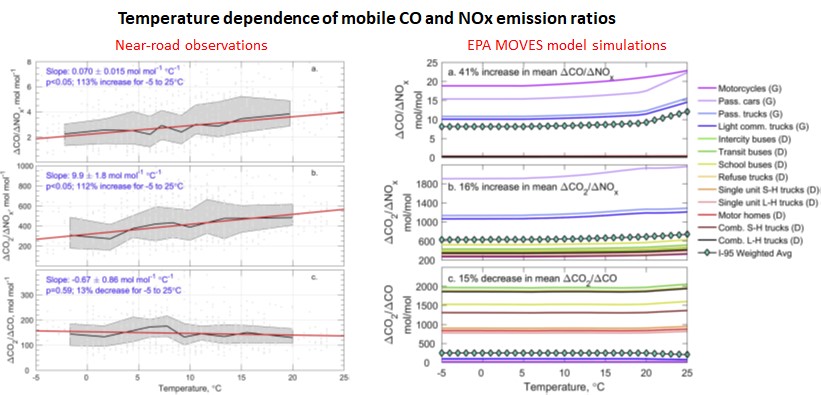
Vehicles are a significant source of carbon monoxide (CO) and nitrogen oxides (NOx), two harmful pollutants and precursors to ozone formation. Previous studies have shown that emissions of NOx in the US EPA’s National Emissions Inventory (NEI) are overestimated relative to observations in the summer and possibly for an annual average. Here we use measurements of CO, NOx, carbon dioxide (CO2), and meteorological variables collected at a near-road (NR) site along I-95 in Howard County, Maryland, during the cold months of 2016 and 2017, to infer ΔCO/ΔNOx, ΔCO2/ΔNOx, and ΔCO2/ΔCO emission ratios from vehicular running exhaust and their sensitivity to temperature and specific humidity. We also use aircraft observations of CO, NOx, and meteorological variables collected during the 2011 summertime DISCOVER-AQ campaign over the Baltimore-Washington region to analyze the impact of temperature and humidity on ΔCO/ΔNOx ratios, which integrate anthropogenic and biogenic sources in the urban area. Overall, we find a strong, statistically significant increase of 113% in ΔCO/ΔNOx and of 112% in ΔCO2/ΔNOx from −5 to 25 °C at the I-95 NR site, indicating a decrease of approximately 50% in emissions of NOx as air warms, linked primarily to diesel-powered trucks. Temperature sensitivity of pollution control equipment on diesel vehicles may contribute to this trend. Results are robust when using several different techniques for calculating emission ratios. The sensitivity of vehicular emissions of NOx to specific humidity is much weaker and cannot solely explain the trend with temperature. The aircraft data show a similar increase of 114% in ΔCO/ΔNOx from 25 °C to 34 °C, with a weaker sensitivity to specific humidity. In comparison to the NR observations, ΔCO/ΔNOx output from the MOtor Vehicle Emission Simulator (MOVES) with default settings, used to simulate mobile emissions for air quality models and in the NEI, showed a smaller increase for ΔCO/ΔNOx of 41% over the temperature range −5 to 25 °C. The increase in ΔCO/ΔNOx from MOVES is due to an increase in emissions of CO by 23% and a decrease in emissions of NOx by 11% over −5 to 25 °C, which is less than the observed decrease in NOx. Our study suggests that the overestimate in emissions of NOx in the NEI previously reported using summertime observations may be corrected in part by accounting for the temperature sensitivity of mobile NOx running emissions within MOVES. Future work will focus on improving MOVES by adjusting parameters controlling the impact of temperature and humidity on emissions to better represent the behavior of real-world vehicular emissions.

Comparison of Near Road Observations versus EPA MOVES model simulations.

