
ARL Weekly News – August 28, 2020
| Recent Events |
Methane Inventory in Maryland.
On August 25, Xinrong Ren attended a virtual meeting on Methane Inventory Enhancement Partnership with Maryland Department of Environment (MDE) and University of Maryland (UMD). In the meeting, Xinrong and his colleagues at UMD provided MDE policy-relevant scientific information based on published aircraft and surface observation results. The goal of the meeting was to improve the State of Maryland’s methane emission inventory. Methane is the second most important greenhouse gas next to carbon dioxide and is 86 times as potent as carbon dioxide in terms of global warming potential over a 20-year timefra,e. Compared to the observed methane emissions, the current MDE methane inventory is lower by a factor of two. Two emission sectors, natural gas system and solid waste management (landfills), were identified as the main targets to reconcile the methane inventory to the observed emission estimates. An improved methane inventory will help achieve the emission reduction goal required by the Maryland’s Greenhouse Gas Emission Reduction Act (GGRA); a 40% reduction in greenhouse gas emissions by 2030 from the 2006 baseline.
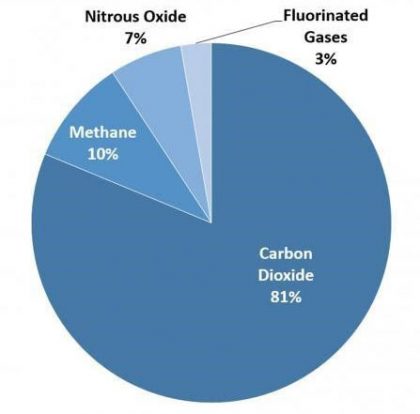
Composition of overall greenhouse gas emission in the U.S. in 2018
U.S. Climate Reference Network (USCRN) and August Severe Weather Events.
Dr. Howard Diamond reported on the role of the U.S. Climate Reference Network (USCRN) with respect to two recent Severe Weather Events:
(1) Major Hurricane Laura made landfall as a very strong major Category 4 storm with maximum sustained winds of 150 miles per hour (mph) early in the morning of Thursday August 27, 2020 near Lake Charles, LA. Laura is the most powerful hurricane to strike Louisiana in over a century. As of 4:00 am CDT on August 27, maximum sustained wind from Laura were at 120 miles per hour – a strong, major category 3 hurricane – and came within 90 miles of the USCRN station in Lafayette, LA. The station in Lafayette continued to operate through the duration of the storm – which speaks to the high-quality of engineering applied to USCRN stations – and since Aug 25, 2020 with the storm approaching has recorded nearly 6 inches of rain, with nearly 4 inches of that recorded on the morning of the 27th alone. The USCRN station in Batesville, AR is the closest USCRN station to the track of Laura (within 30 miles) and that station has also continued to operate flawlessly. In the map (left), the red pushpins represent the locations of USCRN stations and the black line is the track of Hurricane Laura.
(2) On August 16, 2020, air temperatures reached 54.4°C (129.9°F) at the Death Valley National Park observing station at Furnace Creek, CA. This is a Cooperative Observer Program (COOP) Network station and the maximum temperature was reported as 130°F using the traditional rounding to the nearest whole digit. About 29 km (18 mi) to the north-northwest is the USCRN station in Stovepipe Wells, CA at an altitude about 85 m (278 ft) above that of Furnace Creek. That day, the USCRN station observed a maximum temperature of 51.5°C (124.7°F). While this may seem inconsistent, an analysis of the summer (June, July, August) daily maximum temperatures since this station was installed in 2004 indicates that the USCRN station averages 1.4°C (2.5°F) less than the COOP station, mainly due to the elevation difference. Local topography and variations in winds and cloud cover cause many days to experience even larger differences in temperatures. Within this distribution of differences, the 2.9°C (5.2°F) difference this day is at the 84th percentile, making it unusually large but not significantly out of the normal range of differences. The next day the station difference in maximum temperature was only 0.7°C (1.2°F). On August 17, the USCRN reached its second highest maximum temperature in station history, 52.1°C (125.8°C), while the COOP station was 52.8°C (127.0°F). The USCRN station at Stovepipe Wells supports the unusual nature of the temperatures during the heat wave, but does not definitively verify or deny the accuracy of the observations of the COOP station at Furnace Creek on a given day.
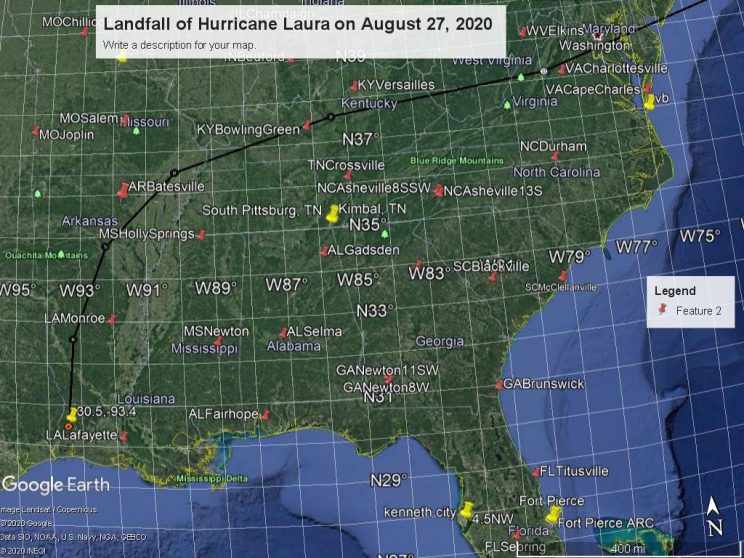
Hurricane Laura Path and Landfall as of August 27.
Summer 2020 Wildfire Air Quality Forecasting.
Through an ARL-NWS wide collaboration, Pius Lee and Patrick Campbell contributed to the following with respect to the current California wildfires and our air quality forecasting:
“The nation is alarmed by the so-called “Northern California’s worst air quality condition in the world” as coined by the news media since mid-August. The numerous concurrent wildfires largely ignited by lightning in Northern California is causing haphazard conditions to properties and human health. The operational National Air Quality Forecasting Capability (NAQFC) designed by ARL and maintained by the National Weather Service is providing vital health advisories to alleviate the damage as well as forewarn the intrusion of smoke plumes in the region. The figures show (left) the near-surface concentration map of harmful smoke-related fine particulates (i.e., PM2.5) overlaid with US. EPA AirNow observations as circles (warmer colors indicate hazardous conditions for sensitive groups), and the right panel shows the time evolution of the accuracy of NAQFC prediction verified by select AirNow sites. Wildfire behavior in spread and heat-fluxes can often be erratic and very difficult to capture. As the figure shows, the NAQFC captured the phenomenon well for the Northern California fires in the past week, and gave air quality managers in the region valuable information-based tools for response measures to avoid adversary conditions for the residents.”
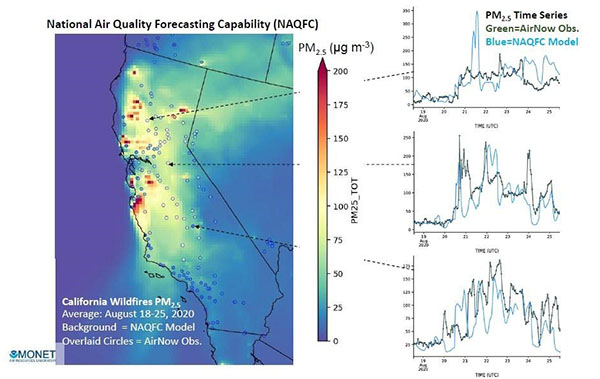
Summer 2020 Wildfire Smoke Conditions: Left: the near-surface concentration map of harmful smoke-related fine particulates (i.e., PM2.5) overlaid with U.S. EPA AirNow observations as circles (warmer colors indicate hazardous conditions for sensitive groups); Right panel shows the time evolution of the accuracy of NAQFC prediction verified by select AirNow sites.