

ARL Weekly News – January 28, 2022
| Recent Events |
USCRN Briefing to Sen. Whitehouse
Dr. Howard Diamond, in his role as the U.S. Climate Reference Network (USCRN) Program Manager, participated in a meeting that was set up by NOAA’s Office of Legislative and Intergovernmental Affairs with Mr. Dan Dudis, senior counsel for Senator Sheldon Whitehouse (D-RI) and team lead for the Senator’s environmental team. The subject of the meeting was a desire on the part of the Senator to build out a network of climate observing stations that would provide us with such data from high-elevation stations above the treeline in the western portion of the U.S. Other participants include Dr. Gary Matlock, DAA for Science in OAR, and representatives from NWS and NESDIS dealing with surface weather observing and climate monitoring.
Specifically, the Senator’s office is interested in developing a network of stations capable of continuously monitoring temperature, wind speed, precipitation, and any other scientifically useful data. Based on some initial discussions they have had with stakeholders in these areas, their thought, at a minimum, was to have two stations in each of the following ranges/places: (1) The Wind River Range; (2) The Tetons; (3) The Beartooths; (4) The Clark, Lewis, and Livingston Ranges; (5) The Sierra Nevadas; (6) The Cascades; and (7) Alaska. Senator Whitehouse is concerned by the fact that we are not currently continuously collecting empirically observed weather data in high alpine environments in the United States, particularly those above the tree line and adjacent to glaciers. As scientists believe that warming increases not just with latitude, but also with altitude, this is a problem for both these ecosystems and our understanding of their futures in a warming world, as well as those who live below them but may rely on their ecosystem services.
Dr. Diamond provided a USCRN overview presentation that focused on how with the right resources, scientific review, and possibly new sensors (e.g., snow depth and 10-meter winds) that the USCRN might be able to fulfill this, but that a National Academy study to better scope out the scientific goals and micro level station siting would be a good possibility to start with. At this point, Howard will work with the Office of Legislative Affairs to get some caveated and estimated costs back to the Senator’s office. The presentation was well received, and this could result in an exciting possible expansion of the USCRN into these high-elevation locations, but we will monitor the progress of this as it unfolds.
HYSPLIT 5.2 Release adds new graphic output options
A new version of ARL’s atmospheric trajectory and dispersion model, HYSPLIT, was released on January 24, 2022. The release was posted on the ARL website and an announcement was sent to over 3,300 registered users. An updated version of the companion tutorial for self-guided study of the model was also released on the same day. Version 5.2 includes an additional capability of producing Scalar Vector Graphic (SVG) outputs in addition to the existing Postscript graphical outputs, a new option for user-defined vertical levels, and other improvements. Precompiled trial versions are available to the public using Windows or Apple computers. Precompiled full-function model versions for Windows, Mac, and Linux computers are available to registered users. ARL’s web services including the READY system, the Locust Migration forecast system, and the Volcanic ash forecast system were updated to use the new version of HYSPLIT. Deployment of version 5.2 for operational use at NWS Weather Forecast Offices is underway. ARL points of contact include: Sonny.Zinn@noaa.gov, Tianfeng.Chai@noaa.gov, Hyun.Kim@noaa.gov, Fantine.Ngan@noaa.gov, Christopher.Loughner@noaa.gov, Alice.Crawford@noaa.gov, Mark.Cohen@noaa.gov.
AMS Conference Highlights
The conference concluded on January 27, 2022. Included among the ARL talks was one by Michael Buban: Development of a Daily-Updating Gridded Soil Water Analysis Model Product (SWAMP) over the Conterminous US. The talk focused on development of soil water products using statistical relationships between measured soil moisture and precipitation at the USCRN stations as a function of soil properties and vegetation type. These relationships are applied to higher-resolution datasets of precipitation, evapotranspiration, and soil and vegetation property datasets in the analysis of soil moisture at a 4-km scale on a daily basis. These datasets are made publicly available in near real-time.
| Recent Publications |
Paper Published: New York City greenhouse gas emissions estimated within inverse modelling of aircraft measurements, in Elementa: Science of the Anthropocene.
- Top down carbon dioxide (CO2) and methane (CH4) emissions estimates were made based on research flights around New York City during the 2018-2020 non-growing seasons.
- An ensemble of HYSPLIT dispersion simulations were performed and used within a Bayesian inverse modeling framework to derive CO2 and CH4 emissions estimates for the New York City metropolitan area.
- Emissions estimates are consistent with inventory estimates of CO2, but are 2.4 times larger than the gridded Environmental Protection Agency (EPA) CH4 emissions inventory. This is consistent with previous work suggesting CH4 emissions from cities throughout the northeast are underestimated.
Abstract:
Cities are greenhouse gas emission hotspots, making them targets for emission reduction policies. Effective emission reduction policies must be supported by accurate and transparent emissions accounting. Top-down approaches to emissions estimation, based on atmospheric greenhouse gas measurements, are an important and complementary tool to assess, improve and update the emission inventories on which policy decisions are based and assessed.
In this study we present results from nine research flights measuring CO2 and CH4 around New York City during the non-growing seasons of 2018 to 2020. We used an ensemble of dispersion model runs in a Bayesian inverse modelling framework to derive campaign-average posterior emission estimates for the New York-Newark, N.J. urban area of (125 ± 39) kmol CO2 s−1 and (0.62 ± 0.19) kmol CH4 s−1 (reported as mean ± 1σ variability across the nine flights). We also derived emission estimates of (45 ± 18) kmol CO2 s−1 and (0.20 ± 0.07) kmol CH4 s−1 for the five boroughs of New York City. These emission rates, among the first top-down estimates for New York City, are consistent with inventory estimates for CO2 but are 2.4 times larger than the gridded EPA CH4 inventory, consistent with previous work suggesting CH4 emissions from cities throughout the northeast U.S. are currently underestimated.
Paper Accepted: Carbon Monoxide Emissions from the Washington, DC, and Baltimore Metropolitan Area: Recent Trend and COVID-19 Anomaly, In Environmental Science and Technology. https://pubs.acs.org/doi/10.1021/acs.est.1c06288 By Israel Lopez-Coto, Xinrong Ren, Anna Karion, Kathryn McKain, Colm Sweeney, Russell R. Dickerson, Brian C. McDonald, Doyeon Y. Ahn, Ross J. Salawitch, Hao He, Paul B. Shepson, and James R. Whetstone
Abstract: We analyze airborne measurements of atmospheric CO concentration from 70 flights conducted over six years (2015–2020) using an inverse model to quantify the CO emissions from the Washington, DC, and Baltimore metropolitan areas. We found that CO emissions have been declining in the area at a rate of ≈−4.5 % a–1 since 2015 or ≈−3.1 % a–1 since 2016. In addition, we found that CO emissions show a “Sunday” effect, with emissions being lower, on average, than for the rest of the week and that the seasonal cycle is no larger than 16 %. Our results also show that the trend derived from the NEI agrees well with the observed trend, but that NEI daytime-adjusted emissions are ≈50 % larger than our estimated emissions. In 2020, measurements collected during the shutdown in activity related to the COVID-19 pandemic indicate a significant drop in CO emissions of 16 % relative to the expected emissions trend from the previous years, or 23 % relative to the mean of 2016 to February 2020. Our results also indicate a larger reduction in April than in May. Last, we show that this reduction in CO emissions was driven mainly by a reduction in traffic.
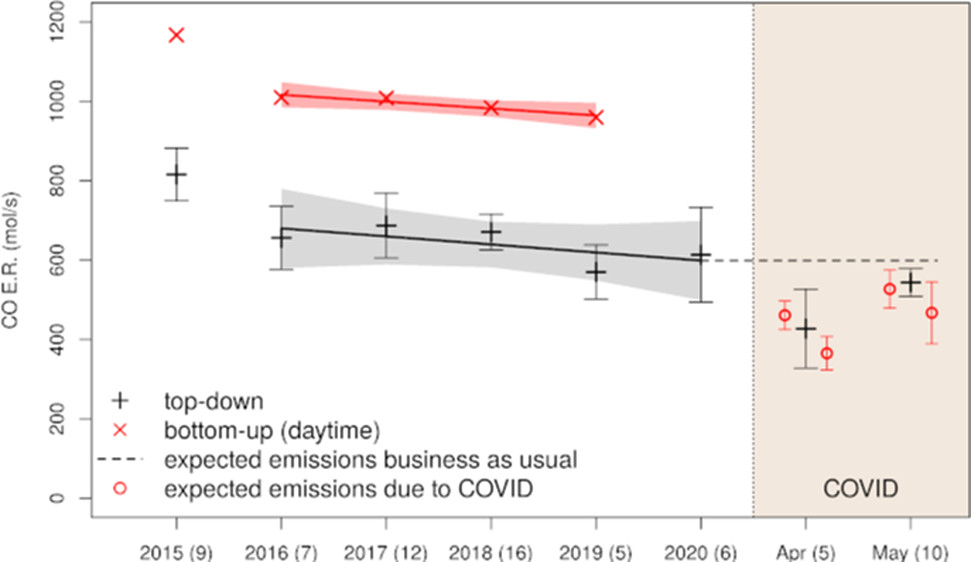
Figure 6 from Lopez-Coto et al: Carbon Monoxide posterior (top–down) emissions rates for DC/Baltimore by year compared to EPA bottom–up estimates (scaled-up to represent daytime values) and annual trends.