

ARL Weekly News – August 18, 2023
| Recent Publications |
Published: Impacts of the COVID-19 economic slowdown on soybean crop yields in the United States
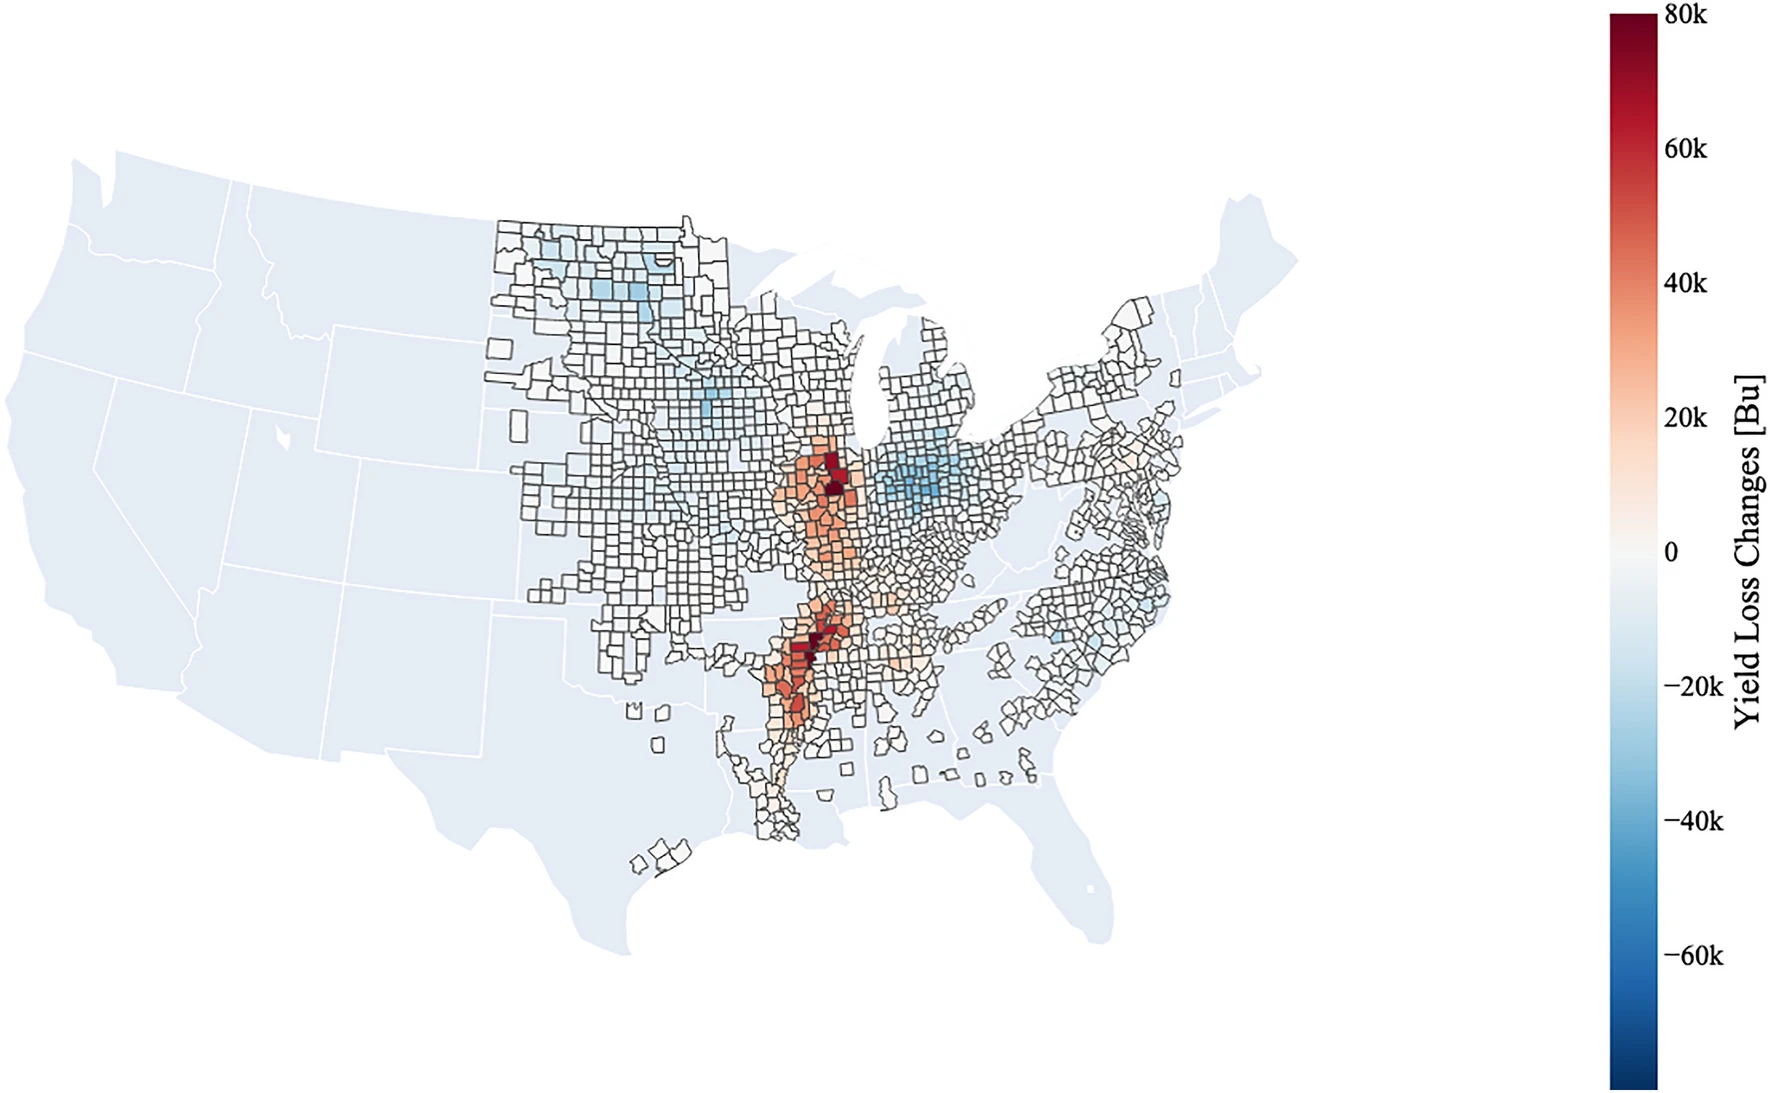
Differences in yield losses between BAU and C19 (i.e., C19-BAU) scenarios by county. Yield improvements (blue counties) are depicted in widespread areas in the Midwest and Southeast. Increased yield loss (red counties) under C19 is present along the Mississippi River Valley. Source: https://doi.org/10.1038/s41598-023-39531-6
Drs. Patrick Campbell and Daniel Tong (ARL-ASMD) co-authored a paper on “Impacts of the COVID-19 economic slowdown on soybean crop yields in the United States”, which was published as an open-access article in the journal Nature (Scientific Reports) on August 3, 2023. Using “business-as-usual” (BAU) and COVID-19 (C19) emissions scenarios investigated in the paper, the resulting surface ozone concentration changes and crop exposures are calculated using the AOT40 cumulative exposure index and then combined with county-level soybean production totals to determine regional yield losses. Exposure changes ranged between – 2 and 2 ppmV/hr. It was further shown that increased exposures (0.5 to 1.10 ppmV/hr) in the Southeast U.S. counteracted decreased exposures (0.8 to 0.5 ppmVhr−1) in the other soybean-producing regions. As a result, corresponding yield improvements counteracted yield losses around the Mississippi River Valley and allowed for minimal improvements in soybean production loss totaling $6.5 million over CONUS.
Reference: Christopoulos, J., Tong, D., Campbell, P.C. et al. Impacts of the COVID-19 economic slowdown on soybean crop yields in the United States. Sci Rep 13, 12574 (2023). https://doi.org/10.1038/s41598-023-39531-6.
Shareable Link: https://rdcu.be/dj2ge
Published: Methodology, Deployment, and Performance of Pico Balloons in Antarctica
McKinney, T., N. Perlaky, A. Crawford, B. Brown, and M. J. Newchurch, 2023: Methodology, Deployment, and Performance of Pico Balloons in Antarctica. J. Atmos. Oceanic Technol., https://doi.org/10.1175/JTECH-D-23-0047.1, in press.
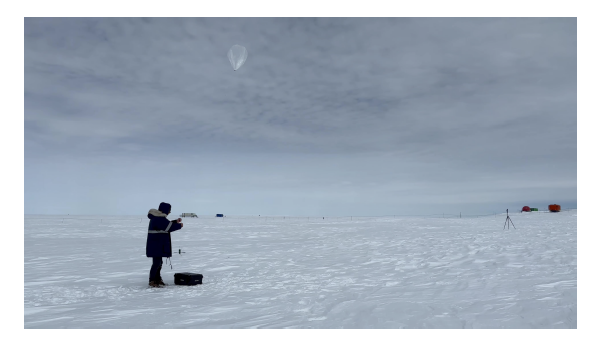
Micro super pressure balloon tethered shortly before launch. Transmitter is below the hands of the person launching. Neumayer station is in the background. Source: https://doi.org/10.1175/JTECH-D-23-0047.1
Abstract: During the 2022/2023 Antarctic summer, eight pico balloon flights were deployed from Neumayer Station III (70.6666° S, 8.2667° W), yielding valuable insights into the Antarctic stratospheric wind structure. Pico balloons maintain a lower altitude compared to larger super pressure balloons, floating between 9 to 15 km AMSL. The most impressive flight lasted an astounding 98 days, completing eight circumnavigations of the Southern Hemisphere. Throughout the flights, pico balloons encountered diverse air masses, displaying zonal velocities ranging from −50 to 250 km hr−1 and meridional velocities between ±100 km hr−1. Total wind speeds observed were extensive, spanning from 2.0 to 270 km hr−1. An significant finding revealed that lower-flying pico balloons could rise due to convection underneath the flight paths, influenced by high convective available potential energy environments, resulting in changes to the balloons’ float density. Moreover, the flights demonstrated that pico balloons tended to drift further south compared to larger stratospheric balloons, with some balloons reaching up to 8 degrees south of the equator and 2 degrees from the south pole. This article explores the pressure-testing process and deployment techniques for pico balloons, showcasing their transformation from inexpensive party balloons (costing less than 20 dollars) into efficient super pressure balloons. The logistical demands for pico balloon flights were minimal, with a single person transporting all materials for the balloons (excluding lifting gas) to the Antarctic continent in carry-on luggage. The authors aim to promote the application of pico balloons to a wider scientific community by demonstrating their usefulness.