ARL Advances Major Upgrade to NAQFC Emission Science
March 2019
March 2019
In February 2019, ARL delivered an upgraded emission and code management package to the National Weather Service (NWS), the organization responsible for operating our country’s National Air Quality Forecasting Capability (NAQFC). Emission projection into the future is both a science and an art, and NWS depends on ARL’s expertise in developing and providing emission input. The significance of this particular upgrade is that it enabled the operational NAQFC to capture and project changes into real-time emission rates distributed across the country at hourly intervals, thereby ensuring more accurate air quality forecasts.
NAQFC model upgrades are performed each year and are centered on the U.S. Environmental Protection Agency’s (EPA) National Emission Inventory (NEI) data for a static base year. The last several annual upgrades utilized 2011 data which, in air pollution forecasting science, is not considered very old since scientists must first work to determine the maturity of data and ensure its quality before they’re able to begin investigating its applicability. After investigating the applicability and impact of NEI2014 data, ARL’s Pius Lee, Daniel Tong, Youhua Tang, and Patrick Campbell aggressively overhauled the base year inventory; jumping all the way to the 2014-based data.
ARL’s comparative analysis of operational data, based on NEI2011, to the newer NEI2014 data, identified the oil and gas industry, energy generation plants, and mobile sources due to vehicular transportation as experiencing the largest changes in terms of ozone and particulate matter precursor species. (Precursors are the “ingredients” that cause chemical reactions to produce harmful species, i.e. the pollutants that adversely affect human and ecosystem health). The unprecedented rapid change in vehicular and energy generation fuel consumption, along with emissions evolutions in many tens of other sectors, must be thoroughly captured in order to enable accurate air quality forecasting from the NAQFC.
In addition to its major improvement to emission science, ARL also streamlined the NAQFC multiple domain forecast into a single, unified modeling system by synchronizing all software components and versions of the modeling system. The Continental U.S., Alaska and Hawaii no longer have separate software systems; rather – and for the first time – all three domains utilize a single, unified software package called Air Quality Monitoring Version 5.1 (AQM V5.1). ARL collaborated with the Environmental Modeling Center at NOAA’s National Centers for Environmental Prediction to accomplish this upgrade, which is publicly available at https://airquality.weather.gov/.
EPA’s NEI lists the emission strengths of various air pollutants in accordance with their respective sources, content (i.e. chemical composition), and characteristics. Nitrogen dioxide and volatile organic compounds are the chief pollutants of concern for NAQFC and they stem from a wide variety of sources. In the ground transportation sector, for instance, there are large sources along highways from the diesel exhaust of heavy duty trucks.
Particulate matter is the scientific term for the mixture of solid particles and liquid droplets floating in the air. While these particles vary in diameter and width, it is fine particulate matter, or PM 2.5 , that scientists studying the health impacts of poor air quality are most concerned about since these tiny particles can get into the lungs and cause serious health problems. PM 2.5 means that, in a cubic metre mass of air particles, the diameter of particles generally equates to less than 2.5 micrometres.


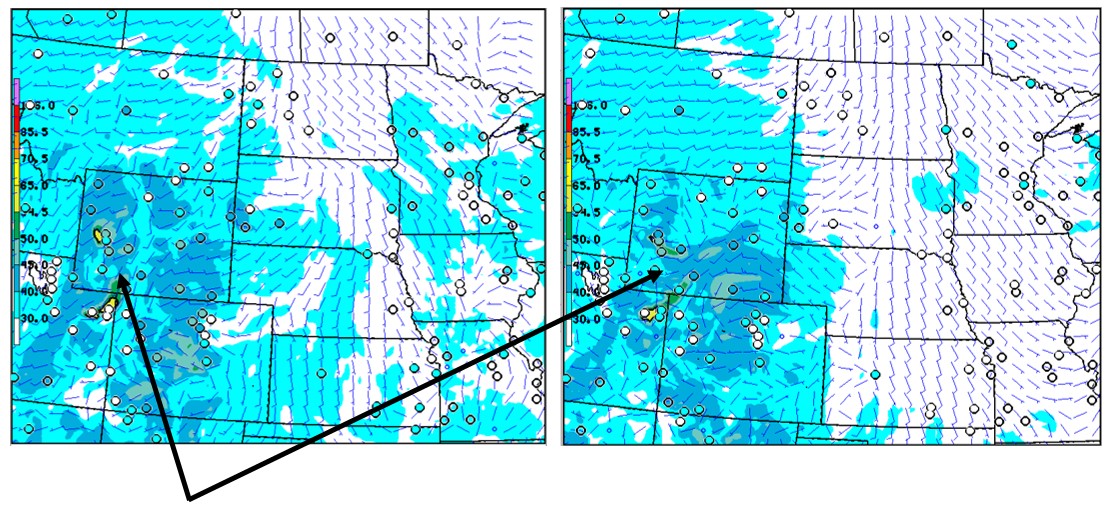
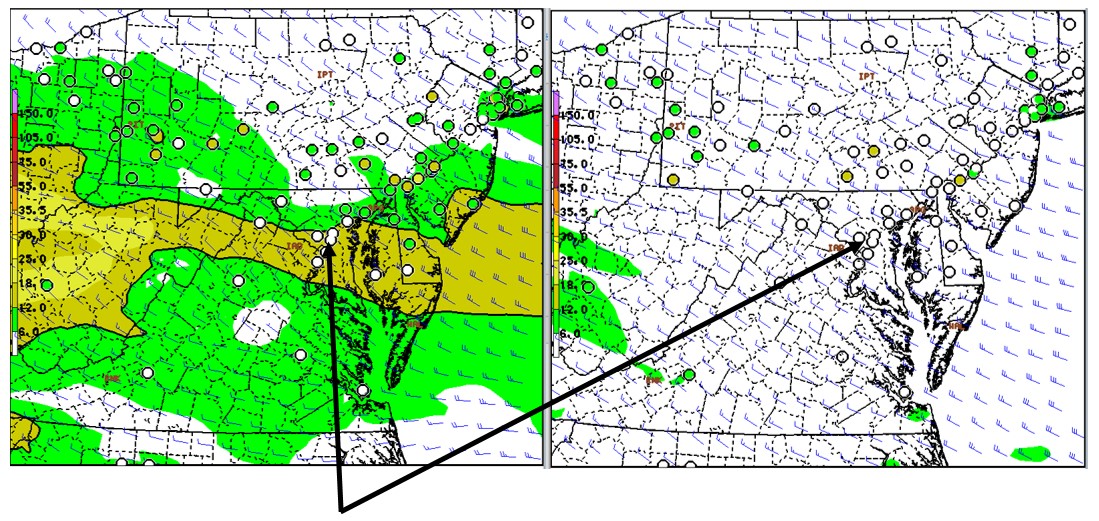
The figure above shows a typical cross-seasonal improvement in both surface ozone (upper panel) and particulate matter smaller than 2.5 micrometres in diameter, or PM 2.5 (lower panel) for the North Plains and Mid-Atlantic, respectively. Lingering meteorological challenges exist in these two areas.