2020 HYSPLIT Accomplishments and Notable Use Cases
January 21, 2020


January 21, 2020
Record Number of HYSPLIT runs in 2020
The ARL developed HYSPLIT tool for atmospheric transport and dispersion modeling hosted over 2 million runs in 2020. The 2,055,410 simulations on the READY server marks a 34% increase from the previous year. The success and reach of online training held in summer 2020, with more than 400 participants, may have enabled new users to access the HYSPLIT tools and use them successfully. Online runs are a fraction of the total HYSPLIT runs during any given year; many users download and run the model on their own computers. The HYSPLIT transport and dispersion model is used for targeted forecasts and products as varied as volcanic ash, mercury deposition, or airborne hazardous materials emitted from industrial events.
Locust Swarms in Africa
In its first year of operation, the Locust swarm forecasting tool saw over 5000 runs, including a number of batch runs of multiple swarms. Primarily used by the UN Food and Agriculture Organization in the African subcontinent forecasts, the tool is still in its first year of operation. The tool forecasts the movement of locust swarms which destroy grains, grasses, and other food production capabilities in the region. Enhancements to the Locust forecasting tool are continuing in 2021, and the capabilities and usage of the tool is expected to increase in the future.

Desert locust swarm. Credit: FAO
Usability Improvements
Behind the scenes, ARL’s software engineers worked to upgrade the interface to HYSPLIT to provide timely and accurate location information to NOAA forecasters. A variety of location enhancements, such as improving the ring radius when selecting a location, were tested in fall 2020 and made available on the NOAA servers in January 2021.
Volcano Response
HYSPLIT is used by Volcanic Ash Advisory Centers to forecast downwind concentrations of ash after volcanic eruptions so that aircraft can be alerted to avoid dangerous ash levels. Washington and Alaska Volcanic Ash Advisory Centers (VAAC’s) used HYSPLIT to assess and respond to volcanic eruptions. A new volcanic ash simulation web server has been developed in 2020 to incorporate updated satellite observations and meteorological data ensembles into ash forecasts. In addition, a new HYSPLIT simulation methodology for volcanic eruptions has been developed.
Nuclear Response
HYSPLIT continued to be used in nuclear applications during 2020, including its operational uses with the Washington Regional Specialized Meteorological Center (RSMC) and the Comprehensive Test Ban Treaty Organization (CTBTO) . The Washington RSMC participated in monthly emergency planning exercises throughout the year and work has continued on the implementation of a new approach.
Wildfire Response
HYSPLIT continued to be used operationally by the National Weather Service to create daily forecasts of wildfire smoke throughout the United States, to aid in the mitigation of public health threats. Future HYSPLIT wildfire simulation capability work includes an inverse-modeling system to estimate wildfire emissions and the incorporation of a new plume-rise algorithm into the HYSPLIT code, to be further tested in 2021. HYSPLIT continued to be used at Weather Forecast Offices to help local authorities decide and plan for prescribed burns.
Model Evaluation and Improvement
ARL is evaluating and improving the HYSPLIT model by comparing its predictions against real-world observations. Several reanalyses of ARL’s historical tracer experiments were carried out in 2020. Work also continues using Tracers of Opportunity in which pseudo-experiments are constructed from cases with known emissions and downwind measurements. Numerous projects focused on using SO2 emissions from power plants, measured with Continuous Emissions Monitoring Systems (CEMS), coupled with downwind SO2 measurements, and results are emerging that will lead to and quantification and reduction of uncertainties in HYSPLIT dispersion simulations.
Wide Use as a Research and Analysis Tool
HYSPLIT continues to provide reliable data tool to support policy-relevant analysis by governmental, non-governmental, and academic researchers. HYSPLIT’s popularity derives from the fact that it is free and easy to use, making its powerful analytical capabilities highly accessible. HYSPLIT serves as key model contributing to society’s scientific enterprise. As one metric of its use, there were 481 publications (Web of Science, accessed Jan 14, 2021) in 2020 citing Stein et al. 2015, a HYSPLIT review article, with most of these publications utilizing HYSPLIT directly in their analysis. The Stein et al., 2015 HYSPLIT publication is a Highly Cited Paper in Web of Science, recognizing that it has received more citations than 99% of all papers in its field for its publication year. As of Jan 2021, Stein et al., 2015 had been cited 2397 times according to Google Scholar since its publication, including 679 citations during 2020.
HYSPLIT is used operationally by NOAA Weather Forecast Offices to plan for and respond to emergency situations. Hundreds of events were analyzed during 2020, but here are a few examples of notable 2020 events where HYSPLIT offered actionable information:
2020 New Year’s Eve celebrations, Jan 2020
When the year kicked off to fanfare, the NYC municipal safety did simulations to ensure municipalities did forecasts to ensure that public safety could be assured. Similar analyses were also conducted for the 2021 New Years, despite prohibitions in most areas on public gatherings.
USS Bonhomme Richard fire, July 2020
The initial fire aboard the Bonhomme Richard, anchored off of San Diego, was controlled until winds coming off the San Diego Bay whipped initial flames up the elevator shafts and the exhaust stacks, causing the fire to spread. Two explosions followed, one heard as far as 13 miles away. As acrid smoke billowing over San Diego and was observed far away from the source, HYSPLIT runs indicated the bands of concern for air quality, and local officials recommended people avoid exercising outdoors. The fire took four days to control and was the worst naval fire in recent history.

Fire aboard USS Bonhomme Richard at Naval Base San Diego on July 12, 2020. Image Credit: US Navy.
Chemical Plant in Lake Charles, LA, August 2020.
2020’s devastating Hurricane season had an outsized impact on Louisiana, and Hurricane Laura, a Category 4 storm packed 150 mph winds. Dotted with refineries and chemical plants, the gulf region is particularly vulnerable to chemical leaks and fires. On August 27, chemicals from a BioLab chemical plant in Lake Charles, Louisiana, began to decompose during the storm, generating heat and igniting. Once the first fire was extinguished, a second fire erupted, and the radius of the shelter-in-place order was expanded. The plant produced chlorine and other highly reactive chemicals that can be toxic when emitted into the atmosphere.
Chemical plant explosion in West Virginia, December 2020.
The residents of Belle, WV were awoken by an explosion on Dec 9, 2020. Since the plant produced chlorinated dry bleach and methanol, authorities quickly imposed shelter-in-place orders to ensure resident safety. The explosion also injured four people at the chemical plant.
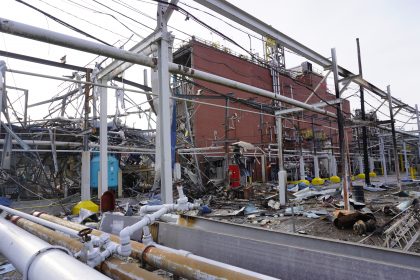
Debris from Belle, WV Chemical Plant Explosion
by Margaret Simon, NOAA OAR, Air Resources Laboratory