Air Quality Forecasting Upgrade Set to Take Effect
April 2020


April 2020
ARL’s National Air Quality Forecasting Capability (NAQFC) team recently delivered its annual emissions update package to NOAA’s National Weather Service (NWS), our country’s operational entity for air quality forecasting. Comprised of both upgraded emissions and code management, the package will be uploaded to NWS’ operational supercomputer at the National Centers for Environmental Prediction (NCEP) and will take effect on April 15.
Drs. Pius Lee, Youhua Tang, Patrick Campbell and Daniel Tong are the team members responsible for ensuring NAQFC forecast performance. One major aspect of their responsibility is performing quality assurance on, then ensuring the inclusion of, the latest major point-source emissions from exhaust stacks in power plants and large energy generation facilities. The stacks are equipped with continuous monitoring devices to measure the emission rates of sulfur dioxide (SO2) and nitrogen oxide (NOx), the major precursors for (i.e. the “ingredients” that cause chemical reactions to produce) ozone (O3) and fine particulate matter (PM2.5) which, in turn, are the two most critical pollutants in defining air quality that impacts human health.
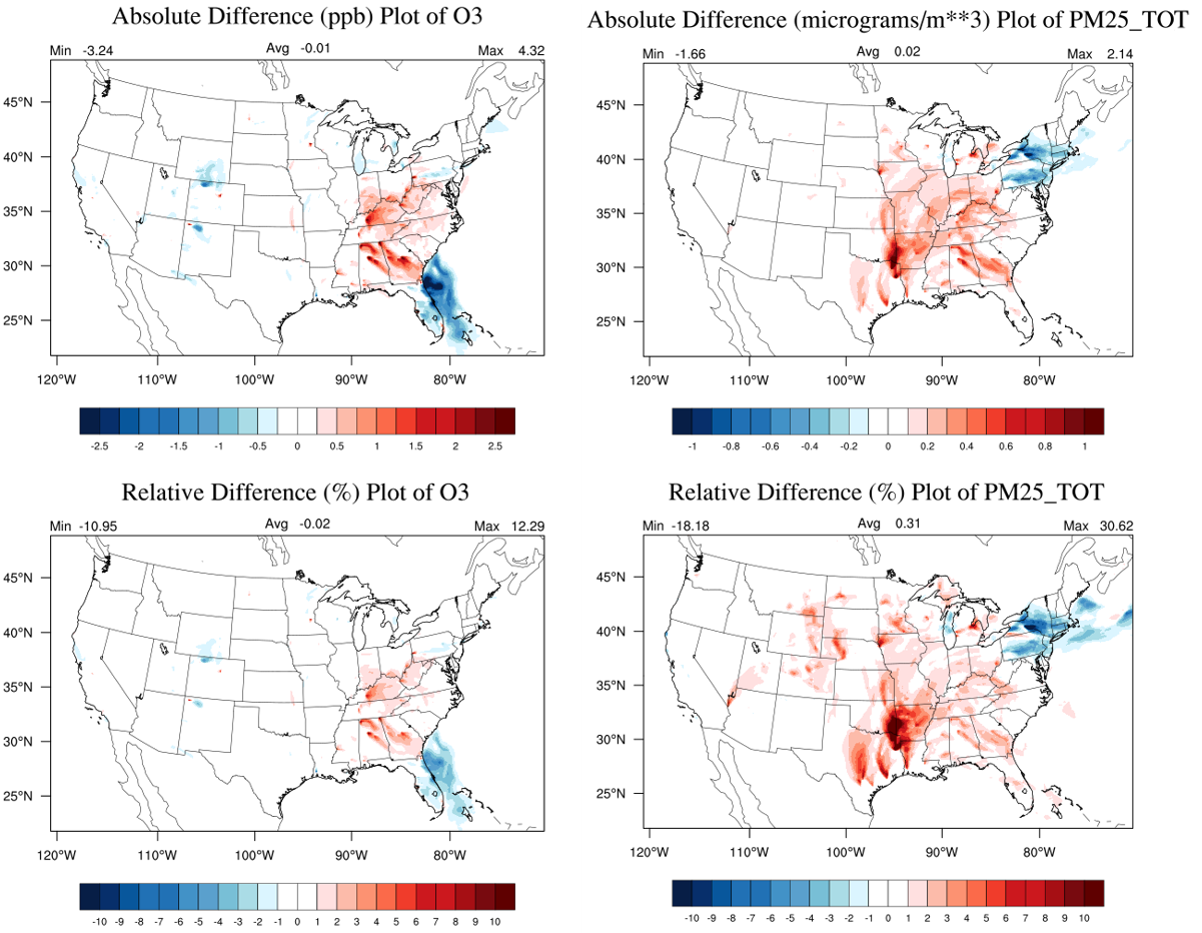
The team superimposed the latest annual emissions data from the U.S. Energy Information Association with the U.S. Department of Energy’s annual energy consumption outlook to calculate major point-source emission strengths for SO2 and NOx in 2020, then performed sensitivity studies utilizing the projected emissions for two cases. One of the cases was in summer, when there tends to be a high concentration of O3, and one in winter, when PM2.5 tends to be in high concentration. The figures below show the expected chemical concentration changes for O3 and PM2.5 in the summer case compared to 2019 actuals (also referred to as the baseline).
ARL presented findings for the new emissions’ projected impact on air quality to their NCEP counterparts in advance of the planned upgrade and received approval for implementation. The estimations yielded no surprises, finding:
• O3 concentration is expected to increase by less than one percent over 2019 values.
• There could be a few localized O3 concentration spikes in the industrialized regions of the Northeast U.S., depicted by red shading in the figures at left, but they’re expected to remain within a few percent of 2019 values.
• PM2.5 concentration is relatively unchanged, with an expected increase of less than one percent over 2019.
• There could be a few localized PM2.5 concentration spikes around the Mississippi Valley, depicted by red shading in the figures at right, varying by a few tens of percent from 2019.
Credit: NOAA