Vertical Meteorological Profile |
|||
 Previous |
 Next |
|
|
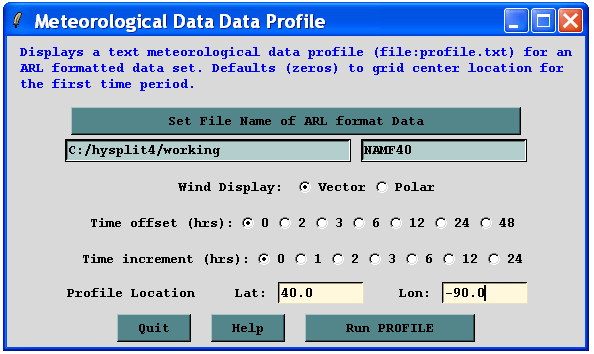
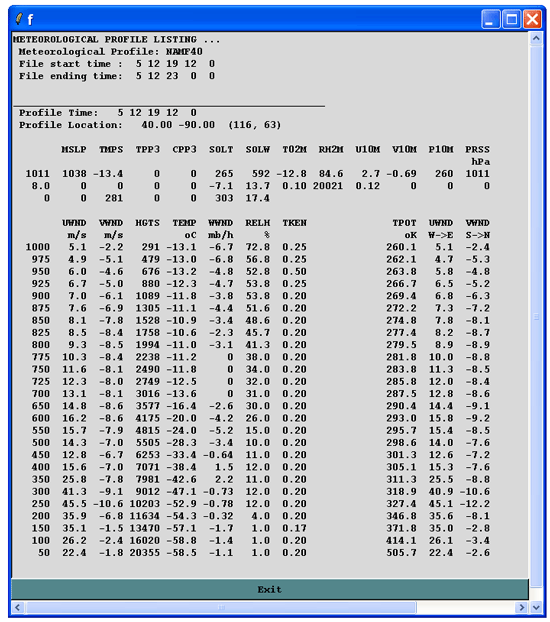
The Text Profile program creates a simple text based listing of the meteorological data profile at a selected latitude-longitude point. In the example below, the NAM 40km data set was selected with default values for offset and increment; zeros indicate that only the first time period is displayed. The profile location was chosen at 40N, 90W.
The data are shown for the nearest grid location, with no temporal or spatial interpolation. The location grid index (I,J) is indicated in parenthesis next to the lat-lon position. The first row shows the surface variables. Subsequent rows show the upper-level data, in this case by pressure level. The leftmost columns show the data directly from the file, while on the right side ambient temperatures have been converted to potential temperature and wind components have been rotated from the native grid to true compass direction. In this case they are almost identical because the location chosen was near the center of the grid. The leftmost coordinate is pressure as taken from the index (INDX) record. In other coordinate systems the program computes a height. This program can be useful in validating the data when investigating a problem with a HYSPLIT calculation.
Previous |
Next |