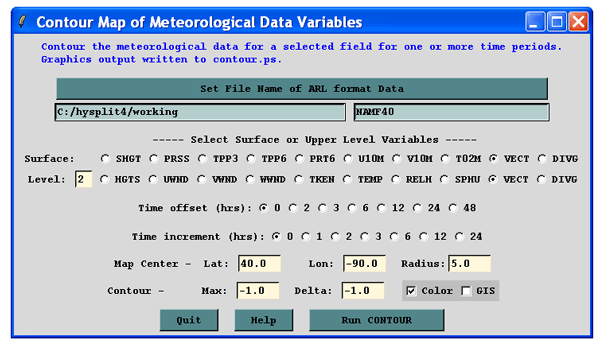
Contour Meteorological Data |
|||
 Previous |
 Next |
|
|
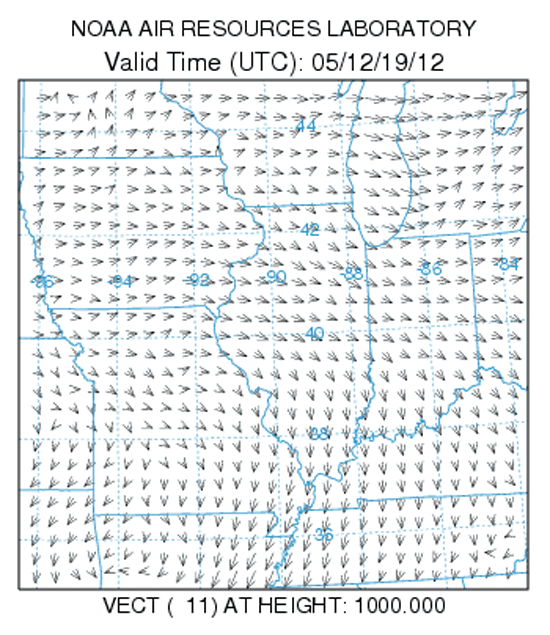
The Contour Map program creates a Postscript graphic of a meteorological variable on a horizontal map. In the example shown below, the NAM 40 km data set was chosen with default values for Time offset and Time increment. Zeros indicate that only the first time period is to be displayed. A Map center location of zeros for latitude and longitude sets the default map to the center of the data grid; in this example the map will be centered over the source location 40N, 90W. Negative values for the Contour maximum and Delta force the automatic contour scaling. All possible meteorological variables are NOT shown, nor may a data file contain all the variables in the selection list. More options are available from the command line version of the program called display.exe. In this example, wind velocity vectors instead of contours were chosen to be plotted for data level 2, which from the previous profile program example corresponds to the 1000 hPA surface. The velocity vectors are shown at every grid point over the domain selected for display; in this case a map with a Radius of 5 degrees latitude. The “11” in parenthesis after the variable symbol “VECT” indicates that the maximum wind speed vector on the map was 11 m/s.
Creating GIS output of meteorology
Checking the GIS box will create an ESRI Generate text file containing the latitude and longitude points of the contours. This text file can then be converted to an ESRI shapefile by using the GIS to Shapefile option in the Utility Programs submenu. Once the shapfile is created (3 files make up a shapefile: .shp, .shx, and .dbf), it can be viewed in a GIS application such as the free ESRI ArcExplorer program. Shown below on the left is a contour map of NAM 12 km 1000 mb heights after converting the Postscript file to a gif file. On the right is the same data shown within ArcExplorer overlayed on a map background. Other shapefiles can also be added to the image if available.
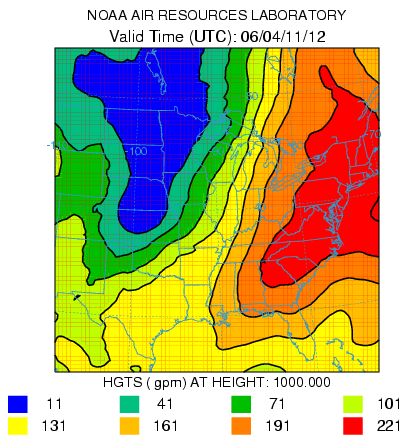 1000 mb heights from the HYSPLIT GUI |
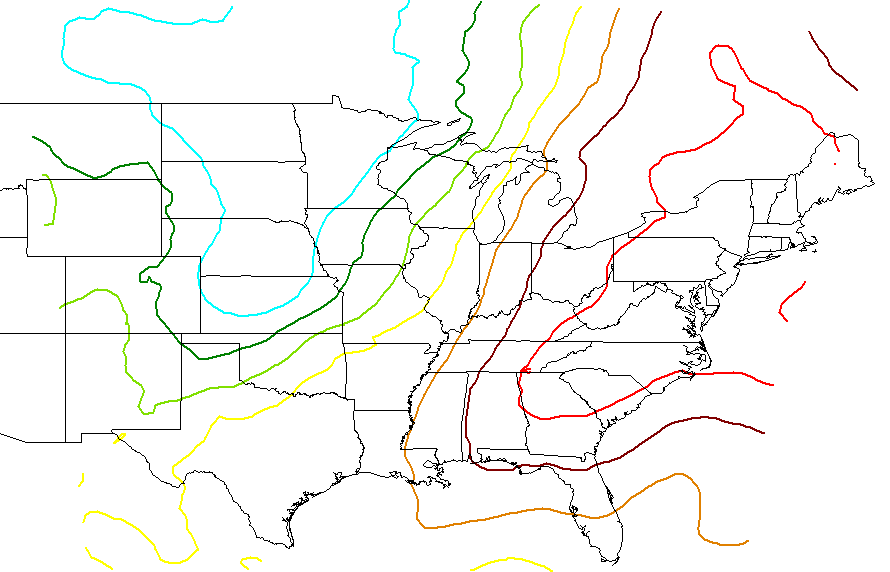 1000 mb heights from ArcExplorer |
Previous |
Next |