Meteorological Analysis Along a Trajectory |
|||
 Previous |
 Next |
|
|
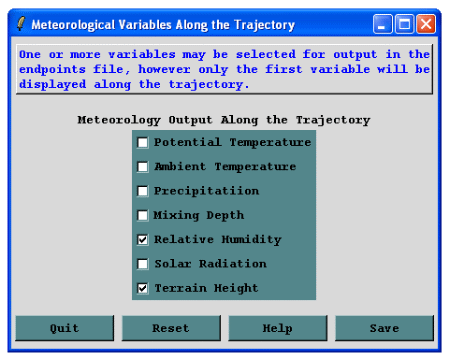
HYSPLIT can provide details on some of the meteorological parameters along the trajectory if the appropriate boxes are selected by the user in the Advanced/Configuration Setup/Trajectory menu. This information can be useful in diagnosing why a trajectory took the path it did, to show the underlying terrain height, to show the mixed layer depth along the trajectory, or to show if any precipitation was being produced along the trajectory path by the meteorological model. Currently only ambient and potential temperature, precipitation, mixing depth, relative humidity, solar radiation, and terrain height are available to output or display.
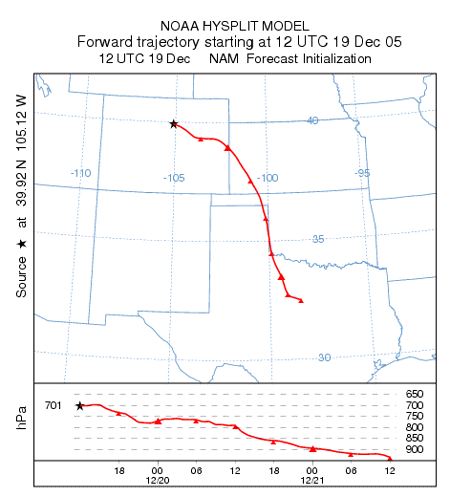
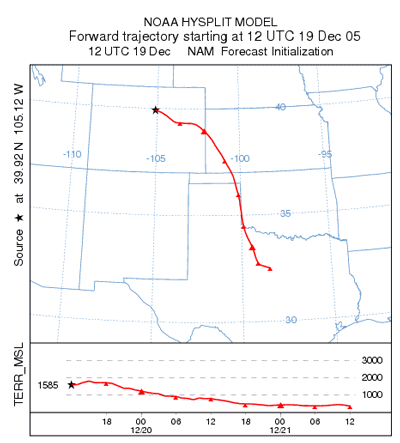
| Configure the CONTROL file for a trajectory simulation again from Broomfield, Colorado, (39.92N and 105.12W) using the NAM 12 km data. However, this time set the starting height to 1500 m, the vertical motion data field to 0 (Data), and the total run time to 84 hours. The resulting trajectory (right) goes to the southeast into central Texas, decending from 700 hPa to nearly 950 hPa. |
|
|
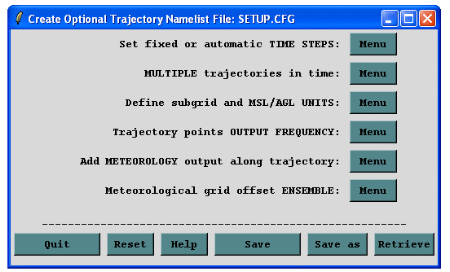
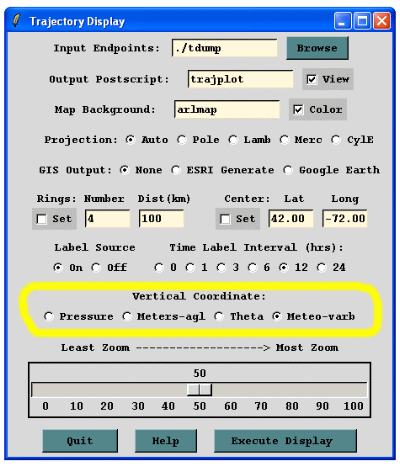
If values of selected meteorological variables are desired along the trajectory, a flag in the SETUP.CFG file can be set through the Advanced / Configuration Setup / Trajectory menu tab. To clear any previous settings, click Reset then click on the Add METEOROLOGY output along trajectory button (right). The Meteorological Variables Along the Trajectory menu will appear (lower-right). One or more fields may be selected and all will be written to the trajectory endpoints file (tdump) in the columns to the right, however only the rightmost (or last selected) variable will be plotted at the bottom of the trajectory map if the plotting option is enabled. Save the settings and Run the Standard Model. Upon completion of the calculation, the vertical coordinate used to display the trajectory can be selected from the Trajectory Display menu (below, left). Pressure and height are available for all trajectories, potential temperature (theta) is only available for isentropic trajectories, and only the last selected (right-most) meteorological variable can be plotted. Set the vertical coordinate to Meteo-varb and Execute the Display. In the figure below, right, the bottom graph shows the terrain below the trajectory as it decends into Texas. Note that if you set the Vertical Coordinate to Meters-agl and redisplay the graphics, the trajectory actually follows the terrain for the most part, so care must be exercised when interpreting the up or down movement of the trajectories. |
|
 |
 |
Previous |
Next |