Example Dispersion Calculation |
|||
 Previous |
 Next |
|
|
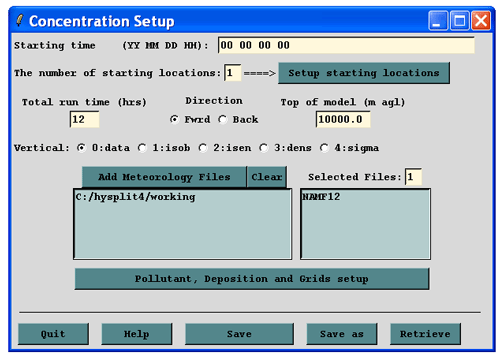
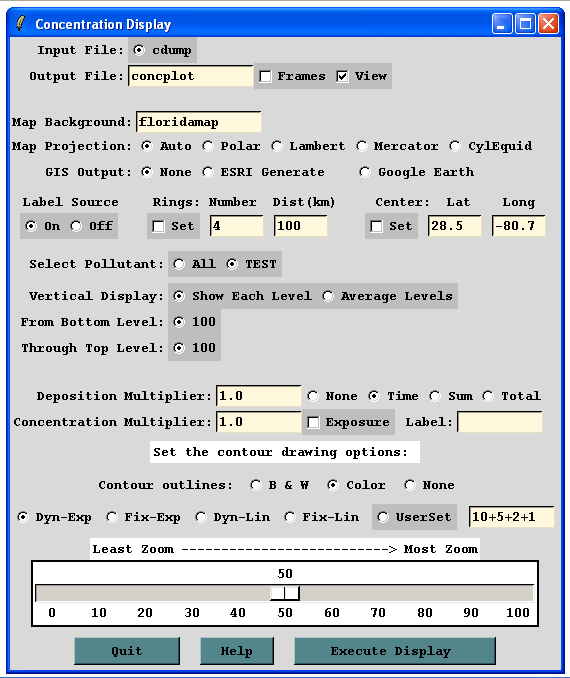
The concentration setup menu is shown below for the example at the beginning of this section (NAM 12 km data, release 28.5N 80.7W 10m, 12 h emission and simulation, snapshot concentration after 12 h, Top-hat-horizontal and vertical puff, and 5000 particles – the Advanced / Configuration Setup / Concentration menu).
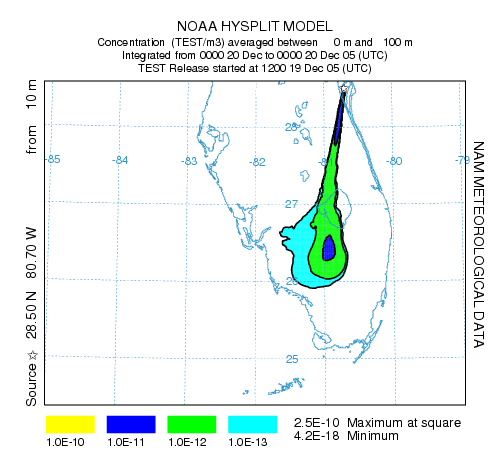
After choosing Run Standard Model, the results can be
displayed through the Concentration Display menu. In this example,
all concentration display default values were used to generate the graphic except that the map
background was set to a high-resolution Florida map background file (floridamap).
This file and other high resolution map backgrounds can be downloaded from the NOAA ARL website at:
http://www.arl.noaa.gov/ready/hysp_util.html#MAPS
| All HYSPLIT simulations generate a text MESSAGE file, which contains diagnostic information about the calculation. Use the View MESSAGES link from the Advanced menu tab to view the last MESSAGE file. In this case (right), at the end of the simulation, 12.00002 units of mass were still on the domain. The vertical mass distribution showed more than 91% of the mass to be within 430 m of the ground. The vertical mass distribution is computed independently of the vertical concentration grid. | 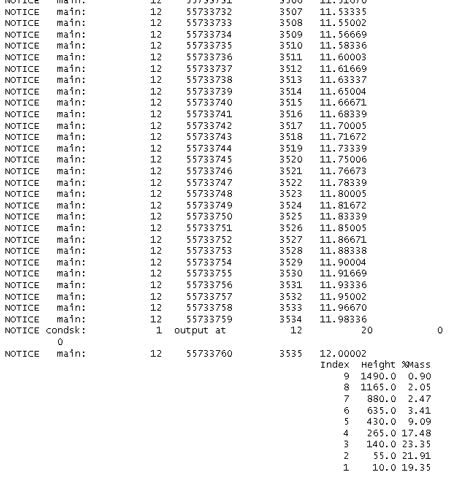 |
As an exercise, the model can be rerun from
the command prompt using the CONTROL and SETUP.CFG
files that were created by the GUI. These could then be edited
manually for different simulations. Most programs, such as the
concentration plotting program concplot, have additional command line options
available that are not supported by the GUI.
Previous |
Next |