Google Earth Output |
|||
 |
 |
|
|
Graphical output from the trajectory and concentration programs can be exported into a compressed file (*.kmz) for use in Google Earth; a software package to display geo-referenced information in 3-dimensions.
| For this example see Example 8 Powerpoint (Ex8_hysplit.ppt) or, either rerun the Florida example or click on the Modify the trajectory plot without rerunning the model from the last run over Florida. To create the Google Earth formatted file check the Google Earth box in the Display Options menu. Make sure that the starting heights were set to Meters-agl for this model run, otherwise the labeling will be incorrect in Google Earth. This will result in the normal graphical file and a file called HYSPLITtraj.kmz that will be linked on the Model Results page. |
|
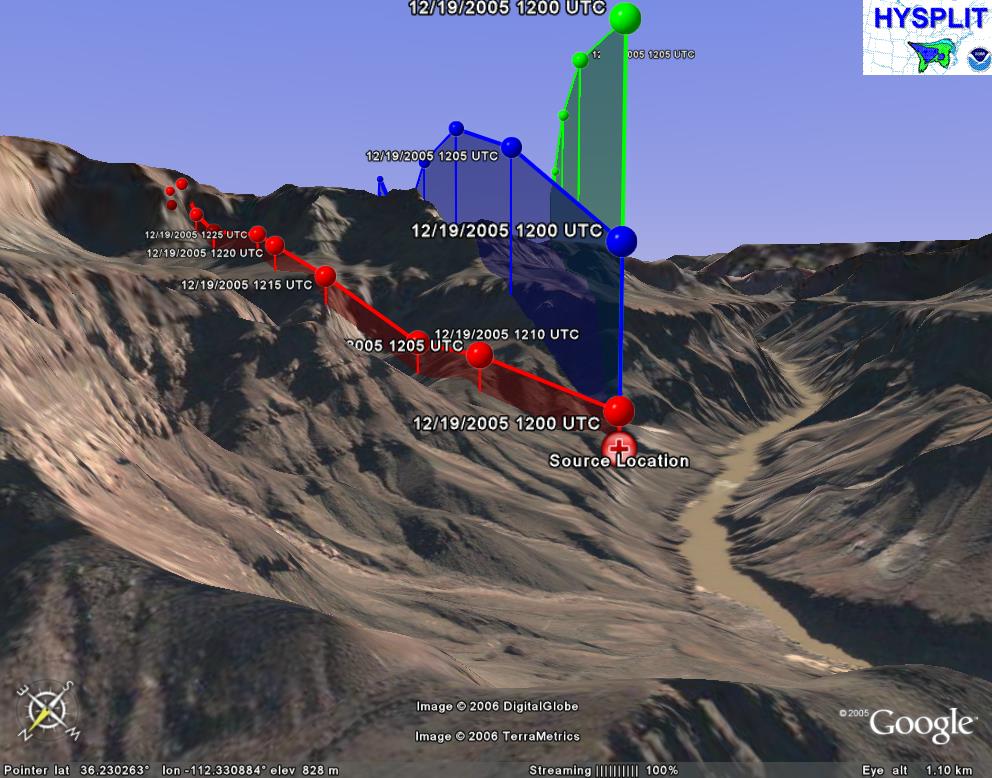
Double click on the Google Earth link and the file will automatically open in Google Earth and zoom in to the source location. Users can turn on/off the trajectories, terrain, and other features within Google Earth. Clicking once on any of the trajectory endpoints will cause an information box to appear giving the height and lat/lon location of the endpoint. Double clicking on an endpoint or any other feature will cause the program to zoom to that location. Expanding the menu along the left side of the display will reveal the different layers associated with the trajectory display. The jpg image below was created by doing a File / Save Image within Google Earth.

| Finally, as an example to show the 3-dimensional terrain (NOTE: the Google Earth terrain
is different from the meteorological model terrain so that the model contours and trajectories
may be below or above the shown terrain), a trajectory run was produced
from a location in the Grand Canyon. To run this case see Example 9 Powerpoint
(Ex9_hysplit.ppt) or, use the following inputs: |
|
The resulting 1 hour trajectory Google Earth file (output is at 5 minute intervals when running a 1 hour duration trajectory) shows the trajectories climbing out of the remarkable landscape of the Colorado River basin.
Previous |
Next |