Example Local Scale Dispersion Calculation |
|||
 Previous |
 Next |
|
|
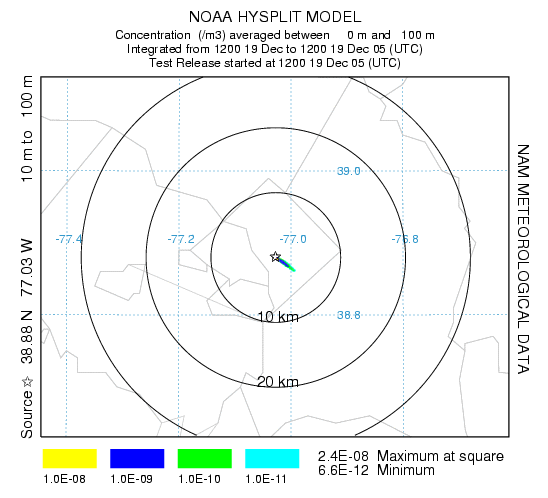
HYSPLIT can be configured for applications such as emergency response, when the scale of the simulation is on the order of 10-30 km. For this example, set up the run as shown below for Washington, D.C. (release location 38.880N 77.027W 10m and 100m), using the NAM 12 km forecast data, a 1-h emission and simulation, average concentration after 1 h, a lat/lon grid resolution of 0.001 degrees and a grid span of 1.0 degrees lat/lon. Then using the Advanced / Configuration Setup / Concentration menu, set the model to use the 3-D horizontal and vertical particle method, 1000 particles, 10000 maximum number of particles, and the Short-range isotropic similarity method for the turbulence computation.

After choosing Run Standard Model, set the number of rings to 3 every 10 km in the
Concentration Display menu (below), set the map background to countymap, the
zoom to 100% and turn off the contour outlines.
The countymap file can be downloaded from the NOAA ARL website at:
http://www.arl.noaa.gov/ready/hysp_util.html#MAPS

| The resulting plume (right) produces a very narrow plume moving southeast into Maryland over the 1 hour period. As will be shown later, the Google Earth or ESRI shapefiles could also be generated here and allow the emergency manager to overlay the plume with other geographic features. |  |
|
Now assume the release was very small and only lasted 15 minutes. Use the Concentration setup / Pollutant, Deposition and Grids setup menu (right) to define a 15 minute (0.25h) release of one unit of mass. Note that since the release rate required is per hour, you will need to multiply the mass by 4 in this case. In addition, we would like to make an animation of 10 minutes average air concentrations over 1 hour, which can be defined in the concentration grid setup menu. |
 |
 Previous |
 Next |
