Google Earth Output |
|||
 |
 |
|
|
Graphical output from the trajectory and concentrtion GUI programs can be exported into a compressed file (*.kmz) for use in Google Earth; a software package to display geo-referenced information in 3-dimensions. You must have the Info-Zip file compression software installed to compress the Google Earth file and associated graphics. Info-Zip is included as part of the HYSPLIT distribution and can be found in the \exec directory.
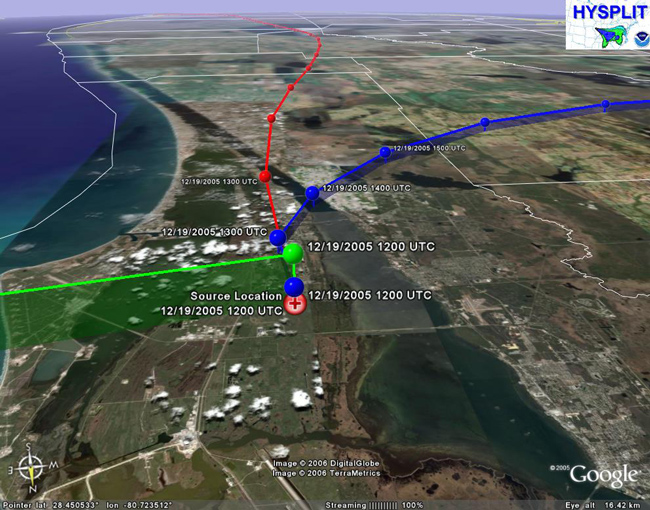
| For this example, load and run the CONTROL file for the Florida example, which starts 3 trajectories: 10, 1000, and 3000 m AGL. To create the Google Earth formatted file check the Google Earth box in the Trajectory Display menu and make sure the Vertical Coordinate is set to Meters-agl (otherwise the labeling will be incorrect in Google Earth). This will result in the normal Postscript file and a file called HYSPLITtraj.kmz. |  |
Locate the Google Earth file in the working directory and, assuming Google Earth has been downloaded and installed, double click on the Google Earth file. Google Earth will open automatically and zoom in to the source location. Users can turn on/off the trajectories, terrain, and other features within Google Earth. Clicking once on any of the trajectory endpoints will cause an information box to appear giving the height and lat/lon location of the endpoint. Double clicking on an endpoint or any other feature will cause the program to zoom to that location. Expanding the menu along the left side of the display will reveal the different layers associated with the trajectory display. The jpg image below was created by doing a File / Save Image within Google Earth.
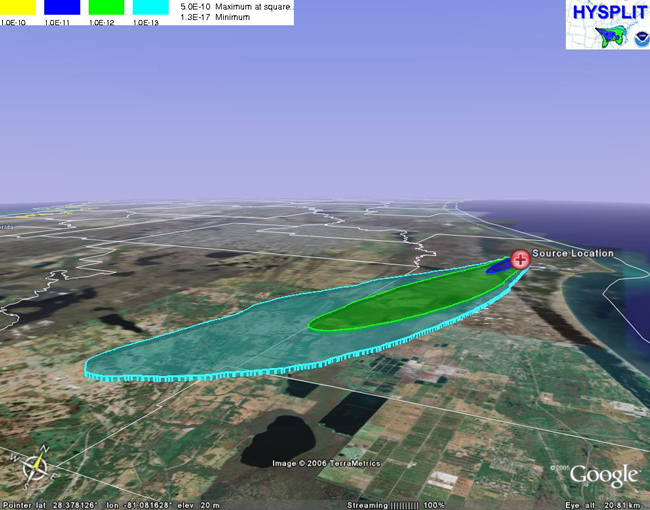
| In the next concentration example, load and run the CONTROL file and use 5000 particles and select the Top-hat-horizontal particle vertical method for the SETUP.CFG file. This will create two 3h average surface to 500 magl output maps from the same Florida location. To create the Google Earth formatted file check the Google Earth box in the Concentration Display menu. This will result in the normal Postscript file and a file called HYSPLITconc.kmz. |  |
Again, locate the Google Earth file in the working directory and double click to open it in Google Earth. In this case there are 2 plumes to display (0-3h and 3-6h averages). The image below shows the 0-3h average between the ground and 500m AGL. Using the controls in Google Earth allows the user to rotate, pan, and zoom the plume. Click on the second 3h average plume link on the left menu to overlay it on the 0-3h average plume.
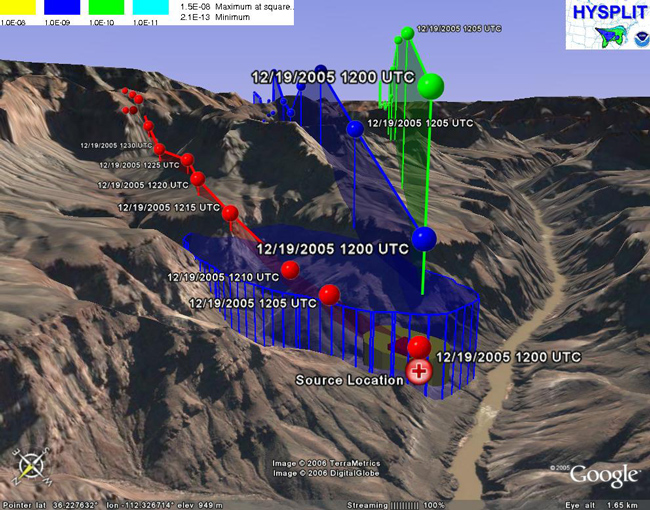
Finally, as an example to show the 3-dimensional terrain (NOTE: the Google Earth terrain is different from the meteorological model terrain so that the model contours and trajectories may be below or above the shown terrain), a trajectory and a concentration run was produced from a location in the Grand Canyon. The concentration CONTROL and SETUP.CFG files can be used to reproduce the concentration Google Earth file, and the trajectory CONTROL and SETUP.CFG files can be used to reproduce the trajectory Google Earth file.
Previous |
Next |