Modeling PM10 Emissions from Dust Storms |
|||
 Previous |
 Next |
|
|
| The model contains a PM10 emission algorithm that
will emit particles from grid-cells with a desert land-use classification
and a friction velocity that exceeds a certain threshold value. More
detail on this approach can be found in the on-line HYSPLIT references.
To set up the model for such a simulation, an approach similar to the matrix configuration is employed. Set up three starting locations representing the domain limits over which dust will be emitted and the third representing the grid resolution. |
 |
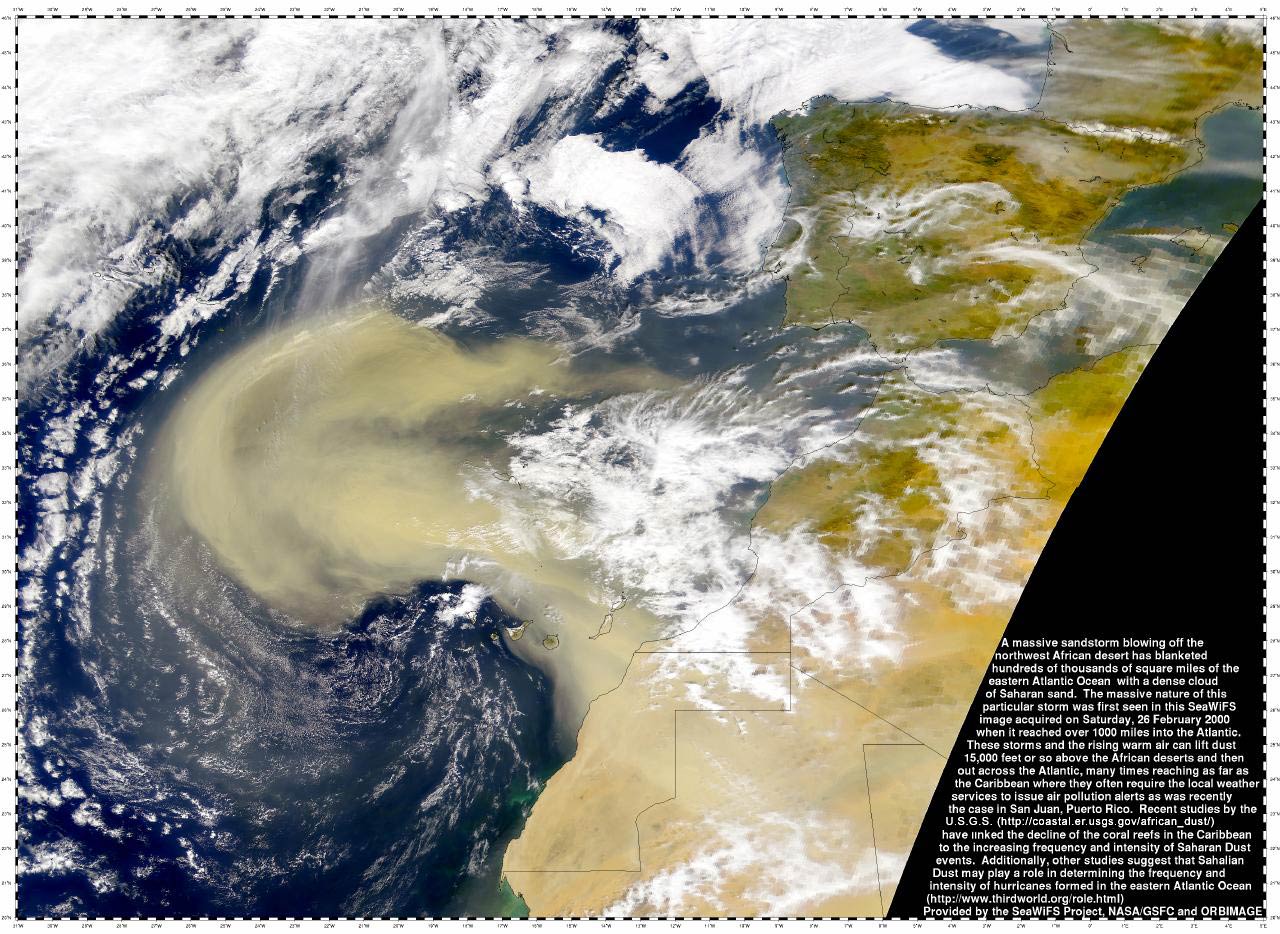
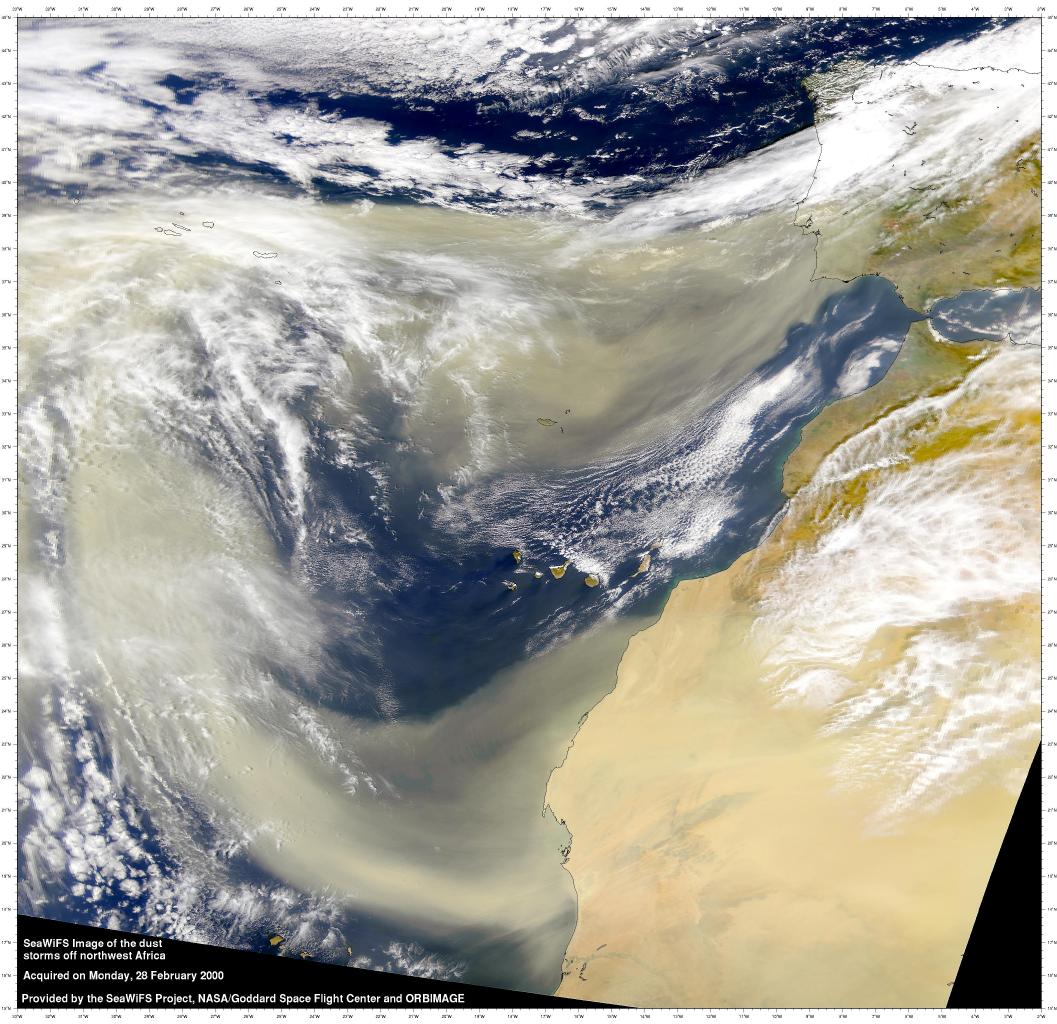
For this example set up the model to run for a region over North Africa, starting at 0000 UTC February 23, 2000, for a duration of 4 days (96 hrs). One of the largest dust storms ever captured by the SeeWiFS satellite (26 Feb 2000, 28 Feb 2000) occurred during this period. Use the FNLDUST.bin archive data and set the concentration grid resolution to 0.2 degrees and the span to 50.0 and 100.0 to speed up the calculation. The emission duration should be set to 48 hours and set the model to output a snapshot after 24 hours.
| The initial CONTROL file will only have 3 starting locations. From the Advanced / Configuration Setup / Concentration / In-line Chemical Conversion Modules menu, set the conversion module to Enable the PM10 dust storm emission algorithm for desert landuse, output a particle dump file after 96 hours, and set the model type to 500 3D horizontal and vertical particles. The particle dump output file will also be used in the next example. Other parameters in the SETUP.CFG file can have their default value. |  |
| The model is run from the Run Dust Storm tab of the Special Simulations menu. This causes the execution of a pre-processor that writes out the value of all the desert land-use locations to the CONTROL file that will be used for the simulation. Only grid cells where the friction velocity exceeds the threshold value will emit dust particles. Upon completion of the simulation use the Particle Display program to show the dust distribution, which is very similar to the satellite image from the 26th. Note the dust at lower elevations (black particles) moving southeast over over Africa. |   |
Previous |
Next |