Source Attribution Functions |
|||
 Previous |
 Next |
|
|
Running the air concentration prediction model backwards is comparable to a back trajectory calculation but it includes the dispersion component of the calculation. The result, although it looks like an air concentration field is more comparable to a source attribution function. If the atmospheric turbulence were stationary and homogeneous then this attribution function would yield the same result from receptor to source as a forward calculation from source to receptor.
| Configure the model as the default top-hat-particle to run from the receptor location (31N, 22W, 1500 m) for 96 hours backward from 0000 UTC February 27th using a 1-hour emission and with concentration output every 6 hours. The elevated release (1500 m) corresponds to the elevated nature of the TOMS signal. The concentration grid level should be 100 m to correspond to lower-level emissions. The results are shown to the right for the last 6-hour period in the simulation (use the standard concentration Display menu). These results would be interpreted to mean that the emissions in the “yellow” region between 0000 and 0600 UTC February 23 were most likely to have contributed to the measurements on the 27th at 1500 m at 33N, 20W. | 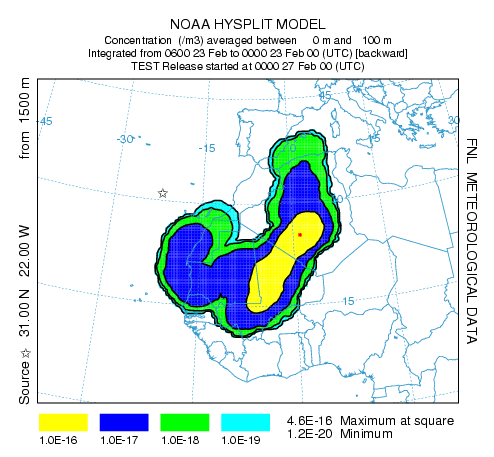 |
Previous |
Next |