Trajectory Error |
|||
 Previous |
 Next |
|
|
A trajectory calculation is composed of four error components:
- the computational error due to numerical inaccuracies,
- the inadequacy of the data’s representation of the atmosphere in space and time,
- measurement errors in creating the model’s meteorological data fields,
- and forecast error if using forecast meteorology.
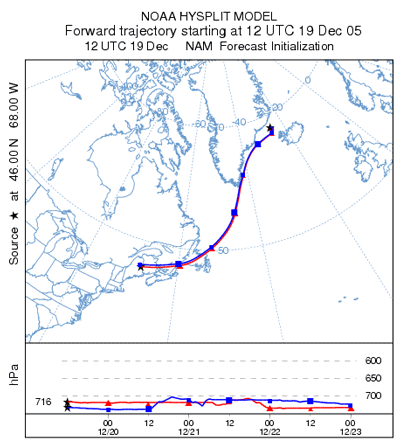
| The numerical accuracy of the computation can be estimated by running a forward and backward trajectory to the origin point. Run the previous 700 hPA isobaric example. View the previous tdump endpoints file, and use the final position (67.796N, 25.527W, 2439.8 m AGL) as the starting point (on the 23th 0000 UTC) for a backward trajectory calculation. Insure that the endpoints file names are different for both the forward and backward calculations by setting the tdump file to tdumpback for example. | 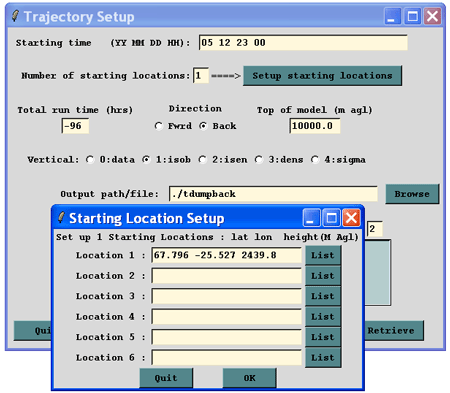 |
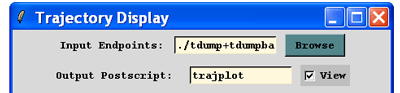
| Then display both trajectories on the same plot by entering both file
names in the Input endpoints: box of the Trajectory
Display GUI using a + symbol (e.g. ./tdump+tdumpback).
Note how the return trajectory is very close to the initial origin point. You can see that the model automatically returned to the NAM 12 km grid at 0900 UTC on December 20 by viewing the tdumpback endpoints file. |
|
| A greater source of error is due to the difficulty in representing atmospheric variables, which are continuous in space and time, by discrete data points on a grid. This error is difficult to quantify, but a sense of the error can be determined by running trajectories using several different sources of meteorological data. In the adjacent calculation, trajectories have been computed using meteorological data from NAM/GFS (red), RUC/GFS (blue), and MM545/GFS (green). After the first 36-h, differences between trajectories are much greater than the numerical error. Note that the green trajectory went up near the end because it hit Greenland (HYSPLIT is terrain following). These calculations are more consistent than most simulations due to the isobaric assumption. | 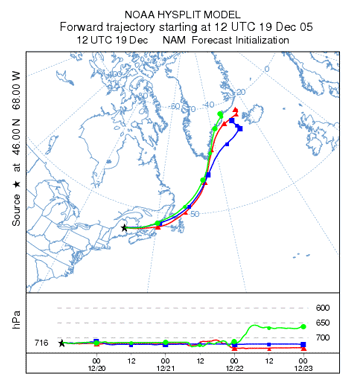 |