Simple Particle Concentration Example |
|||
 Previous |
 Next |
|
|
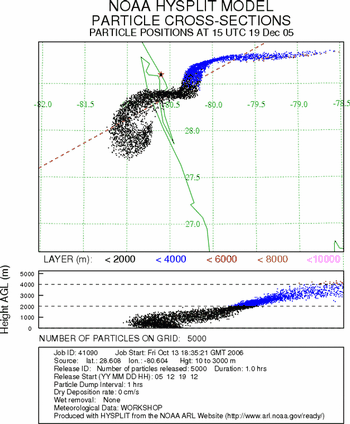
The previous example showed a snapshot of the particle or puff center positions after 3 hours. To compute air concentrations, each particle’s mass is summed as it passes over a concentration grid. PC HYSPLIT can be configured to compute concentrations in several methods:
- 3D Particle (horizontal & vertical)
- Gaussian Puff (horizontal & vertical)
- Top-Hat Puff (horizontal & vertical)
- Gaussian (horizontal) & Particle (vertical)
- Top-Hat Puff (horizontal) & Particle (vertical)
In the Particle mode, the concentration grid is treated as a matrix of cells, each with a volume defined by the grid dimensions. Therefore the concentration is just the particle mass divided by the cell volume.
3D Particle: ΔC = q(Δx Δy Δz)-1
In the Top-Hat Puff calculation, the concentration grid is considered as a matrix of sampling points, such that the Top-Hat Puff only contributes to the concentration as it passes over the sampling point. In the Top-Hat Puff calculation mode it is possible for a puff to pass between points and not be shown on the display.
Top-Hat Puff: ΔC = q(Π r2 Δzp)-1

|
For this example see Example 11 Powerpoint (Ex11_hysplit.ppt)] or, from the main menu, run the dispersion model for the Florida case with the parameters shown to the right . Shown below-right is the resulting concentration pattern associated with the Top-Hat Puff / Particle distribution from the previous example over Florida (below-left). Note the concentration pattern is very similar to the particle pattern and, as expected, the highest concentrations are over the same area that has the highest density of particles. Over central Florida, where the particles are spaced farther apart, the concentrations are less. |
|

|
 |
 Previous |
 Next |